TERRA-REF Documentation
WebsiteGitHubTutorials
Primary version
Primary version
  • Introduction
  • Scientific Objectives
  • Experimental Design
    • The Maricopa Agricultural Center (MAC)
    • Controlled Environment Phenotyping
    • Genomics
  • Data
    • How to Access Data
    • Data Products
      • Environmental conditions
      • Phenotype Data
      • Genomics data
      • Fluorescence intensity imaging
      • Geospatial information
      • Hyperspectral imaging data
      • Infrared heat imaging data
      • Meteorological data
      • Point Cloud Data
      • Controlled Environment phenotype data
    • Data Use Policy
    • Manuscripts and Authorship Guidelines
  • Protocols
    • Field Scanner
    • Sensor Calibration
    • Hyperspectral Data
    • Controlled Environment Protocols
    • Manual Field Data Protocols
    • Phenotractor Protocols
    • UAV Protocols
    • Genomic Protocols
  • Technical Documentation
    • Software
    • Data Standards
      • Existing Data Standards
      • Agronomic and Phenotype Data Standards
      • Genomic Data Standards
      • Sensor Data Standards
      • Data Standards Committee
    • Data Product Levels
    • Directory Structure
    • Data Transfer
    • Data Processing Pipeline
    • Time Series Data in Geostreams
    • Data Backup
    • Systems Configuration
  • Code of Conduct
  • Appendix
    • Glossary
    • Accessing BETYdb with GIS Software
  • References
  • Archived Documentation
    • Developer Manual
      • Submitting data to Clowder
      • Submitting data to BETYdb
      • Submitting Data to CoGe
      • Developing Clowder Extractors
Powered by GitBook
On this page
Export as PDF
  1. Data
  2. Data Products

Geospatial information

PreviousFluorescence intensity imagingNextHyperspectral imaging data

Last updated 5 years ago

Several different sensors include geospatial information in the dataset metadata describing the location of the sensor at the time of capture.

Coordinate reference systems The Scanalyzer system itself does not have a reliable GPS unit on the sensor box. There are 3 different coordinate systems that occur in the data:

  • Most common is EPSG:4326 (WGS84) USDA coordinates

  • Tractor planting & sensor data is in UTM Zone 12

  • Sensor position information is captured relative to the southeast corner of the Scanalyzer system in meters
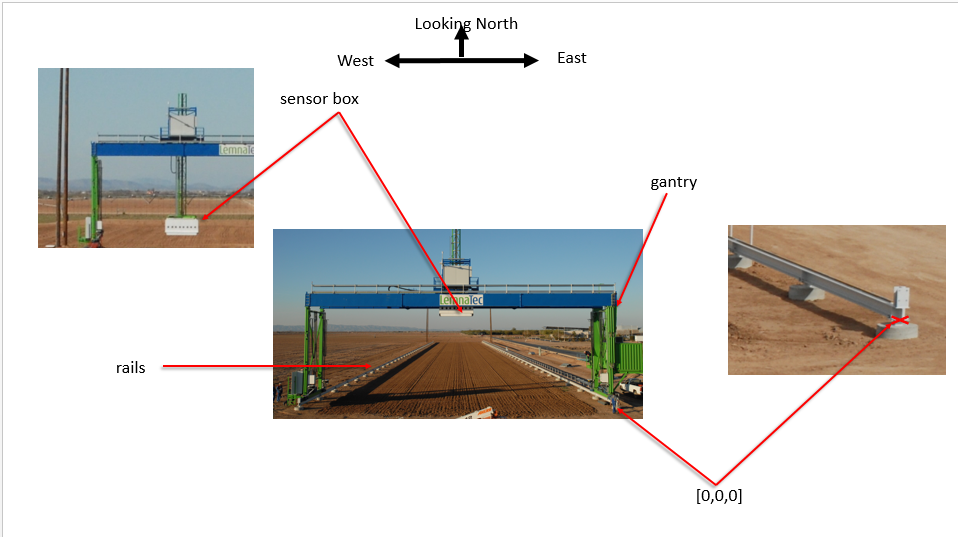
EPSG:4326 coordinates for the four corners of the Scanalyzer system (bound by the rails above) are as follows:

  • NW: 33° 04.592' N, -111° 58.505' W

  • NE: 33° 04.591' N, -111° 58.487' W

  • SW: 33° 04.474' N, -111° 58.505' W

  • SE: 33° 04.470' N, -111° 58.485' W

Scanalyzer coordinates Finally, the Scanalyzer coordinate system is right-handed - the origin is in the SE corner, X increases going from south to north, and Y increases from east to the west.

In offset meter measurements from the southeast corner of the Scanalyzer system, the extent of possible motion for the sensor box is defined as:

  • NW: (207.3, 22.135, 5.5)

  • SE: (3.8, 0, 0)

Scanalyzer -> EPSG:4326 1. Calculate the UTM position of known SE corner point 2. Calculate the UTM position of the target point, using SE point as reference 3. Get EPSG:4326 position based on UTM

MAC coordinates Tractor planting data and tractor sensor data will use UTM Zone 12.

Scanalyzer -> MAC Given a Scanalyzer(x,y), the MAC(x,y) in UTM zone 12 is calculated using the linear transformation formula:

ay = 3659974.971; by = 1.0002; cy = 0.0078;
ax = 409012.2032; bx = 0.009; cx = - 0.9986;
Mx = ax + bx * Gx + cx * Gy
My = ay + by * Gx + cy * Gy

Assume Gx = -Gx', where Gx' is the Scanalyzer X coordinate.

MAC -> Scanalyzer

Gx = ( (My/cy - ay/cy) - (Mx/cx - ax/cx) ) / (by/cy - bx/cx)
Gy = ( (My/by - ay/by) - (Mx/bx - ax/bx) ) / (cy/by - cx/bx)

MAC -> EPSG:4326 USDA We do a linear shifting to convert MAC coordinates in to EPSG:4326 USDA

Latitude: Uy = My - 0.000015258894
Longitude: Ux = Mx + 0.000020308287

Sensors with geospatial metadata

  • stereoTop

  • flirIr

  • co2

  • cropCircle

  • PRI

  • scanner3dTop

  • NDVI

  • PS2

  • SWIR

  • VNIR

Available data All listed sensors

"gantry_system_variable_metadata": {
      "time": "08/17/2016 11:23:14",
      "position x [m]": "207.013",
      "position y [m]": "3.003",
      "position z [m]": "0.68",
      "speed x [m/s]": "0",
      "speed y [m/s]": "0.33",
      "speed z [m/s]": "0",
      "camera box light 1 is on": "True",
      "camera box light 2 is on": "True",
      "camera box light 3 is on": "True",
      "camera box light 4 is on": "True",
      "y end pos [m]": "22.135",
      "y set velocity [m/s]": "0.33",
      "y set acceleration [m/s^2]": "0.1",
      "y set decceleration [m/s^2]": "0.1"
    },

stereoTop

"sensor_fixed_metadata": {
      "cameras alignment": "cameras optical axis parallel to XAxis, perpendicular to ground",
      "optics focus setting (both)": "2.5m",
      "optics apperture setting (both)": "6.7",
      "location in gantry system": "camera box, facing ground",
      "location in camera box x [m]": "0.877",
      "location in camera box y [m]": "2.276",
      "location in camera box z [m]": "0.578",
      "field of view at 2m in X- Y- direction [m]": "[1.857 1.246]",
      "bounding Box [m]": "[1.857     1.246]",
    },

cropCircle

"sensor_fixed_metadata": {
      "location in gantry system": "camera box, facing ground",
      "location in camera box x [m]": "0.480",
      "location in camera box y [m]": "1.920",
      "location in camera box z [m]": "0.6",
    },

co2Sensor

"sensor_fixed_metadata": {
      "location in gantry system": "camera box, facing ground",
      "location in camera box x [m]": "0.35",
      "location in camera box y [m]": "2.62",
      "location in camera box z [m]": "0.7",
    },

flirIrCamera

"sensor_fixed_metadata": {
      "location in gantry system": "camera box, facing ground",
      "location in camera box x [m]": "0.877",
      "location in camera box y [m]": "1.361",
      "location in camera box z [m]": "0.520",
      "field of view x [m]": "1.496",
      "field of view y [m]": "1.105",
    },

ndviSensor

"sensor_fixed_metadata": {
      "location in gantry system": "top of gantry, facing up, camera box, facing ground",
      "location in camera box x [m]": "0.33",
      "location in camera box y [m]": "2.50",
    },

priSensor

"sensor_fixed_metadata": {
      "location in gantry system": "top of gantry, facing up, camera box, facing ground",
      "location in camera box x [m]": "0.400",
      "location in camera box y [m]": "2.470",
    },

SWIR

"sensor_fixed_metadata": {
      "location in gantry system": "camera box, facing ground",
      "location in camera box x [m]": "0.877",
      "location in camera box y [m]": "2.325",
      "location in camera box z [m]": "0.635",
      "field of view y [m]": "0.75",
      "optics focal length [mm]": "25",
      "optics focus apperture": "2.0",
    },

field scanner plots

dimension

value

# rows

32

# rows / plot

2

# plots (2 rows ea)

864

# ranges

54

# columns

16

row width (m)

0.762

plot length (m)

4

row length (m)

3.5

alley length (m)

0.5

The boundary of each plot changes slightly each planting season. The scanalyzer coordinates of each plot are transformed into the (EPSG:4326) USDA coordinates using the equations above.

In the trait database, this site is named the and its bounding polygon is

There are 864 (54*16) plots in total and the plot layout is described in the table.

"MAC Field Scanner Field"
"POLYGON ((-111.9747967 33.0764953 358.682, -111.9747966 33.0745228 358.675, -111.9750963 33.074485715 358.62, -111.9750964 33.0764584 358.638, -111.9747967 33.0764953 358.682))"
plot plan