Data Collection
Maricopa Agricultural Center, Arizona
The Lemnatec Scanalyzer Field Gantry System
Sensor missions
Scientific Motivation
What sensors, how often etc.
Tractor
UAV
Manually Collected Field Data
https://docs.google.com/document/d/1iP8b97kmOyPmETQI_aWbgV_1V6QiKYLblq1jIqXLJ84/edit#heading=h.3w6iuawxkjl6 https://github.com/terraref/reference-data/issues/45
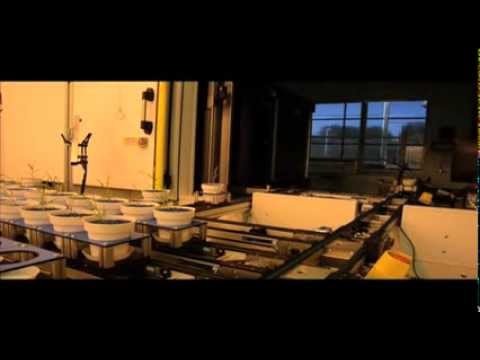
Automated controlled-environment phenotyping, Missouri
The Scanalyzer 3D platform consists of multiple digital imaging chambers connected to the Conviron growth house by a conveyor belt system, resulting in a continuous imaging loop. Plants are imaged from the top and/or multiple sides, followed by digital construction of images for analysis.
RGB imaging allows visualization and quantification of plant color and structural morphology, such as leaf area, stem diameter and plant height.
NIR imaging enables visualization of water distribution in plants in the near infrared spectrum of 900–1700 nm.
Fluorescent imaging uses red light excitation to visualize chlorophyll fluorescence between 680 – 900 nm. The system is equipped with a dark adaptation tunnel preceding the fluorescent imaging chamber, allowing the analysis of photosystem II efficiency.
Capturing images
The LemnaTec software suite is used to program and control the Scanalyzer platform, analyze the digital images and mine resulting data. Data and images are saved and stored on a secure server for further review or reanalysis.
You can read more about the Danforth Plant Sciences Center Bellwether Foundation Phenotyping Facility on the DDPSC website.
Kansas State University
HudsonAlpha - Genomics
Last updated