Loading...
Loading...
Loading...
Loading...
Loading...
Loading...
Loading...
Loading...
Loading...
Loading...
Loading...
Loading...
Loading...
Loading...
Loading...
Loading...
Loading...
Loading...
Loading...
Loading...
Loading...
Loading...
Loading...
Loading...
Loading...
Loading...
Loading...
Loading...
Loading...
Loading...
Loading...
Loading...
Loading...
Loading...
Loading...
Loading...
Loading...
Loading...
Loading...
Loading...
Loading...
Loading...
Loading...
Loading...
Loading...
Loading...
Loading...
Loading...
Loading...
Loading...
Loading...
Loading...
Loading...
Loading...
Loading...
Loading...
Loading...
Loading...
Loading...
Loading...
Loading...
Loading...
Loading...
Loading...
Loading...
Loading...
Loading...
Loading...
The TERRA-REF project is phenotyping the same genotypes of sorghum at multiple locations
Automated Lemnatec Scanalyzer Field System at Maricopa Agricultural Center (MAC)
PhenoTractors on parallel plots at MAC and Kansas State University (KSU)
UAV platform on parallel plots at KSU
Controlled-environment phenotyping systems at the Danforth Center
Manually collected field data at all locations
Whole genome resequencing is being carried out on ~400 sorghum accessions to understand the landscape of genetic variation in the selected germplasm and enable high-resolution mapping of bioenergy traits with genome wide association studies (GWAS). Additionally, ~200 sorghum recombinant inbred lines (RILs) will be characterized with ~400,000 genetic markers using genotyping-by-sequencing (Morris et al., 2013) for trait dissection in the RIL population and testcross hybrids of the RIL population.
Three hundred thirty one lines were planted in 2016. Plantings occurred both under and west of the gantry system.
Field layouts under the gantry and west of the gantry in 2016.
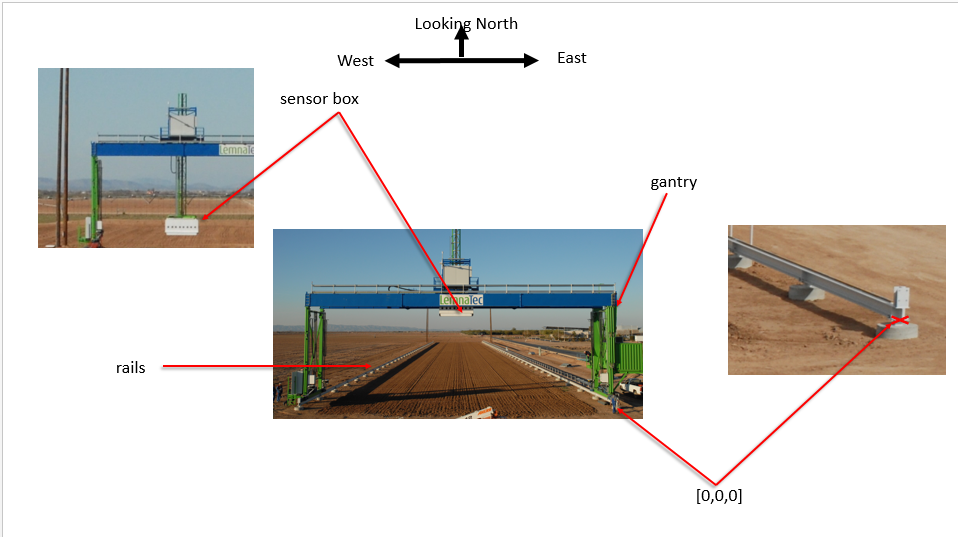
The Lemnatec Scanalyzer Field Scanner System is the largest field crop analytics robot in the world. This high-throughput phenotyping field-scanning robot has a 30-ton steel gantry that autonomously moves along two 200-meter steel rails while continuously imaging the crops growing below it with a diverse array of cameras and sensors.
Twelve sensors are attached to the system. Detailed information for each sensor including name, variable measured, and field of view are available here. The planned sensor missions and their objectives for 2016 are available here.
The PhenoTractor at MAC is fitted with a sensor frame that supports a real time kinematic (RTK) satellite navigation antenna, a sonar transducer, an infrared temperature (IRT) scanner, and three GreenSeeker crop sensing systems.
Coming 2017
In progress
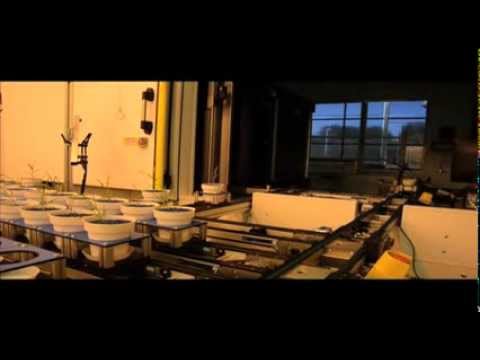
The Scanalyzer 3D platform at the Bellwether Foundation Phenotyping Facility at the Donald Danforth Plant Science Center consists of multiple digital imaging chambers connected to the Conviron growth house by a conveyor belt system, resulting in a continuous imaging loop. Plants are imaged from the top and/or multiple sides, followed by digital construction of images for analysis.
RGB imaging allows visualization and quantification of plant color and structural morphology, such as leaf area, stem diameter and plant height.
NIR imaging enables visualization of water distribution in plants in the near infrared spectrum of 900–1700 nm.
Fluorescent imaging uses red light excitation to visualize chlorophyll fluorescence between 680 – 900 nm. The system is equipped with a dark adaptation tunnel preceding the fluorescent imaging chamber, allowing the analysis of photosystem II efficiency.
The LemnaTec software suite is used to program and control the Scanalyzer platform, analyze the digital images and mine resulting data. Data and images are saved and stored on a secure server for further review or reanalysis.
PhenoTractor - Coming 2017
UAV - Coming 2017
Manually collected field data - Coming 2017
Coming 2017
Authors: Matthew Maimaitiyiming, Wasit Wulamu, and David LeBauer
Center for Sustainability, Saint Louis University, St. Louis, MO 63108
This document provides a brief summary of methods, procedures, and workflows to process the tractor data.
Content modified from .
Tractor
Sensors
Sonar Transducer
GreenSeeker Multispectral Radiometer
Infrared Thermal Sensor
The Tractor-based plant phenotyping system (Phenotractor) was built on a LeeAgra 3434 DL open rider sprayer. The vehicle has a clearance of 1.93 m. A boom attached to the front end of the tractor frame holds the sensors, data loggers, and other instrumentation components including enclosure boxes and cables. The boom can be moved up and down with sensors remaining on a horizonal plane. An isolated secondary power source supplies 12-V direct current to the electronic components used for phenotyping.
The phenotractor was equipped with three types of sensors for measuring plant height, temperature and canopy spectral reflectance. A RTK GPS was installed on top of the tractor, see the figure below.
The distance from canopy to sensor position was measured with a sonar proximity sensor ($S\rm{output}$, in mm). Canopy height ($CH$) was determined by combining sonar and GPS elevation data (expressed as meter above sea level). An elevation survey was conducted to determine a baseline reference elevation ($E\rm{ref}$) for the gantry field. CH was computed according to the following equation:
where $E_rm{s}$ is sensor elevation, which was calculated by subtracting the vertical offset between the GPS antenna and sonar sensor from GPS antenna elevation.
Canopy spectral reflectance was measured with GreenSeeker sensors and the reflectance data were used to calculate NDVI (Normalized Difference Vegetation Index). GreenSeeker sensors record reflected light energy in near infrared (780 ± 15 nm) and red (660 ± 10 nm ) portion electromagnetic spectrum from top of the canopy by using a self-illuminated light source. NDVI was calculated using following equation:
Where $\rho\rm{NIR}$ and $\rho\rm{red}$ and ρ_red represent fraction of reflected energy in near infrared and red spectral regions, respectively.
Georefencing was carried out using a specially developed Quantum GIS (GGIS, www.qgis.org ) plug-in by Andrade-Sanchez et al. (2014) during post processing. Latitude and longitude coordinates were converted to UTM coordinate system. Offset from the sensors to the GPS position on the tractor heading were computed and corrected. Next, the tractor data, which uses UTM Zone 12 (MAC coordinates), was transformed to EPSG:4326 (WGS84) USDA coordinates by performing a linear shifting as follows:
Latitude: $U_y = M_y – 0.000015258894$
Longitude: $U_x = M_x + 0.000020308287$
An Infrared radiometer (IRT) sensors were used measure canopy temperature and temperature values were recoded as degree Celsius (°C).
where $U_y$ and $U_x$ are latitude and longitude in USDA coordinate system, and $M_y$ and $M_x$ are latitude and longitude in MAC coordinate system (see ). Finally, georeferenced tractor data was overlaid on the gantry field polygon and mean value for each plot/genotype was calculated using the data points that fall inside the plot polygon within ArcGIS Version 10.2 (ESRI. Redlands, CA).
Andrade-Sanchez, Pedro, Michael A. Gore, John T. Heun, Kelly R. Thorp, A. Elizabete Carmo-Silva, Andrew N. French, Michael E. Salvucci, and Jeffrey W. White. "Development and evaluation of a field-based high-throughput phenotyping platform." Functional Plant Biology 41, no. 1 (2014): 68-79.
The Maricopa field site is located at the the University of Arizona Maricopa Agricultural Center and USDA Arid Land Research Station in Maricopa, Arizona. At this site, we have deployed the following phenotyping platforms.
The Lemnatec Scanalyzer Field System is the largest field crop analytics robot in the world. This high-throughput phenotyping field-scanning robot has a 30-ton steel gantry that autonomously moves along two 200-meter steel rails while continuously imaging the crops growing below it with a diverse array of cameras and sensors.
The PhenoTractor is fitted with a sensor frame that supports a real time kinematic (RTK) satellite navigation antenna, a sonar transducer, an infrared temperature (IRT) scanner, and three GreenSeeker crop sensing systems.
UAV (release V1)
Manually Collected Field Data - Data will are collected manually using standard field methods. These measurements are used to calibrate and validate phenotypes derived from sensor-collected data.
Tractor - coming 2017
UAV - coming 2017
The Bellwether Foundation Phenotyping Facility is a climate controlled 70 m2 growth house with a conveyor belt system for moving plants to and from fluorescence, color, and near infrared imaging cabinets. This automated, high-throughput platform allows repeated non-destructive time-series image capture and multi-parametric analysis of 1,140 plants in a single experiment.
Genomic data includes whole-genome resequencing data from the HudsonAlpha Institute for Biotechnology, Alabama for 384 samples for accessions from the sorghum Bioenergy Association Panel (BAP) and genotyping-by-sequencing (GBS) data from Kansas State University for 768 samples from a population of sorghum recombinant inbred lines (RIL).
The following protocols have been contributed by TERRA-REF team members:
Field Scanner - Coming 2017
Genomics - Coming 2017
A template for documenting protocols is available here.
This book describes the TERRA-REF data collection, computing, and analysis pipelines. The following links provide quick access to
The ARPA-E-funded Transportation Energy Resources from Renewable Agriculture Phenotyping Reference Platform (TERRA-REF) program aims to transform plant breeding by using remote sensing to quantify plant traits such as plant architecture, carbon uptake, tissue chemistry, water use, and other features to predict the yield potential and stress resistance of 300+ diverse Sorghum lines.
The data storage and computing system provides researchers with access to the reference phenotyping data and analytics resources using a high performance computing environment. The reference phenotyping data includes direct measurements and sensor observations, derived plant phenotypes, and genetic and genomic data.
Our objectives are to ensure that the software and data in the reference data and computing pipeline are interoperable, reusable, extensible, and understandable. Providing clear definitions of common formats will make it easier to analyze and exchange data and results.
The first edition (alpha release) was published November 2016.
The second edition (beta release) will be published November 2018
The third edition (version 1.0) will be published November 2019
TERRA-REF uses a suite of databases and software components that are described below.
Clowder is the primary system used to organize, annotate, and process raw data generated by the phenotyping platforms as well as information about sensors. Use Clowder to explore the raw TERRA-REF data, perform exploratory analysis, and develop custom extractors. For more information, see Using Clowder.
Raw data is transferred to the primary TERRA-REF compute pipeline using Globus Online. Globus also provides access to TERRA REF files, but this is not a primary portal and metadata in Clowder may be required to locate and interpret these files. Use Globus Online when you want to transfer data from the TERRA-REF system for local analysis by accessing the Terraref endpoint. For more information, see Using Globus.
BETYdb is a database and web interface to the trait / phenotype data and agronomic metadata. This is where you can find plant and plot level trait data as well as plot locations and other information associated with agronomic experimental design. Use BETYdb to access derived trait and agronomic data. For more information, see Using BETYdb.
Plant CV is an imaging processing package specific for plants that is built upon open-source software platforms OpenCV, NumPy, and MatPlotLib. Plant CV is used for trait identification, the output is stored in both Clowder and BETYdb.
Each step in the pipeline is performed by an algorithm. These are maintained in the TERRA REF GitHub organization in repositories with names that begin in extractors-*
such as github.com/terraref/extractors-hyperspectral.
The NDS Workbench enables users to access the large filesystem and databases with familiar development environments. We provide a variety of environments for developing new algorithms and integrating them into the TERRA REF pipeline. These include RStudio and Jupyter Notebooks configured for specific use cases such as sensor data processing, trait analysis, database queries, and piepline development.
CoGe contains genomic information and sequence data. For more information, see Using CoGe.
SenseFly eBee fixed-wing drone
Hexacopter
UAV data are collected using one of three cameras:
5-band
4-band + RGB
SenseFly thermal
Cameras are carried singly or in tandem on the SenseFly eBee fixed-wing drone (Sequoia and thermoMap, individually only), or a hexacopter (RedEdge or Sequoia, individually or in tandem).
No radiometric calibration was conducted as of Nov 5, 2016.
QGIS software was used to confirm geospatial alignment of NDVI geotiffs with shape files containing geolocated positions of the rail foundations. A shape file containing polygons aligning with the middle two rows of each of the 350 experimental units (for sorghum crop Aug-Nov 2016) was kindly generated by Dr. A French of USDA-ARS. Zonal Statistics in QGIS was used to calculate NDVI means for each plot polygon.
Automated VIS and NIR imaging in a controlled growth environment
ProMix BRK20 + 14-14-14 Osmocote pots; pre-filled by Hummert Sorghum seed
Conviron Growth House
LemnaTec moving field conveyor belt system
Scanalyzer 3D platform
Planting
Plant directly into phenotyping pots
Chamber Conditions
Pre-growth (11 days) and Phenotying (11 days)
14 hour photoperiod
32oC day/22oC night temperature
60% relative humidity
700 umol/m2/s light
Watering Conditions
Prior to phenotyping, plants watered daily
The first night after loading, plants watered 1× by treatment group to 100% field capacity (fc)
Days 2 – 12, plants watered 2× daily by treatment group (100% or 30% FC) to target weight
Automation
Left shift lane rotation within each GH, during overnight watering jobs
VIS (TV and 2 x SV), NIR (TV and 2 x SV) imaging daily
Field capacity = 200% GWC (200 g water/100 g soil), based upon extensive GWC testing done by Skyler Mitchell
Target weight (fc) = [(water weight at % fc) + [(average weight of carrier/saucer) + (dry soil weight) + (pot weight)]
Water weight at 100% fc = dry soil weight * (%GWC/100)
Water weight at 30% fc = water weight at 100% fc * 0.30
Standard flight altitude is 44m with 75% image overlap (both sequentially and laterally), and missions are programmed and managed by either or senseFly .
Pix4D software was used to generate gray-scale orthomosaic geotiff files containing NDVI data after georegistration to the WGS84/UTM 12 N coordinate reference system using three to five 2D geo-located ground control points. These are manually matched to 5-40 images each. Ground control points for the Lemnatec Field Scanner are on the concrete pylons and were geolocated using an RTK base station maintained by the USDA-ARS at Maricopa (see section on ).
MicaSense:
SenseFly
QGIS
ATLAS LEOTI PI_144134 PI_145619 PI_145626 PI_145632 PI_145633 PI_146890 PI_147224 PI_152591 PI_152651 PI_152694 PI_152727 PI_152728 PI_152730 PI_152733 PI_152751 PI_152771 PI_152816 PI_152828 PI_152860 PI_152862 PI_152923 PI_152961 PI_152963 PI_152965 PI_152966 PI_152967 PI_152971 PI_153877 PI_154750 PI_154844 PI_154846 PI_154944 PI_154987 PI_154988 PI_155149 PI_155516 PI_155760 PI_155885 PI_156178 PI_156203 PI_156217 PI_156268 PI_156326 PI_156330 PI_156393 PI_156463 PI_156487 PI_156871 PI_156890 PI_157030 PI_157033 PI_157035 PI_157804 PI_167093 PI_170787 PI_175919 PI_176766 PI_179749 PI_180348 PI_181080 PI_181083 PI_195754 PI_196049 PI_196583 PI_196586 PI_196598 PI_197542 PI_19770 PI_213900 PI_217691 PI_218112 PI_221548 PI_221651 PI_226096 PI_22913 PI_229841 PI_251672 PI_253986 PI_255239 PI_255744 PI_257599 PI_257600 PI_266927 PI_267573 PI_273465 PI_273969 PI_276837 PI_297130 PI_297155 PI_297171 PI_302252 PI_303658 PI_329256 PI_329286 PI_329299 PI_329300 PI_329301 PI_329310 PI_329319 PI_329326 PI_329333 PI_329338 PI_329351 PI_329394 PI_329403 PI_329435 PI_329440 PI_329465 PI_329466 PI_329471 PI_329473 PI_329478 PI_329480 PI_329501 PI_329506 PI_329510 PI_329511 PI_329517 PI_329518 PI_329519 PI_329541 PI_329545 PI_329546 PI_329550 PI_329569 PI_329570 PI_329584 PI_329585 PI_329605 PI_329614 PI_329615 PI_329618 PI_329632 PI_329644 PI_329645 PI_329646 PI_329665 PI_329673 PI_329699 PI_329702 PI_329710 PI_329711 PI_329841 PI_329843 PI_329864 PI_329865 PI_330168 PI_330169 PI_330181 PI_330182 PI_330184 PI_330185 PI_330195 PI_330196 PI_330199 PI_330796 PI_330803 PI_330807 PI_330833 PI_330858 PI_337680 PI_337689 PI_35038 PI_365512 PI_452542 PI_452619 PI_452692 PI_453696 PI_455217 PI_455221 PI_455280 PI_455301 PI_455307 PI_505717 PI_505722 PI_505735 PI_506030 PI_506069 PI_506114 PI_506122 PI_508366 PI_510757 PI_511355 PI_513898 PI_514456 PI_521019 PI_521152 PI_521280
PI_521290 PI_524475 PI_525049 PI_52606 PI_526905 PI_527045 PI_533792 PI_533902 PI_533998 PI_534120 PI_534165 PI_535783 PI_535785 PI_535792 PI_535793 PI_535794 PI_535795 PI_535796 PI_540518 PI_542718 PI_550604 PI_561840 PI_562730 PI_562732 PI_562781 PI_562897 PI_562970 PI_562971 PI_562981 PI_562982 PI_562985 PI_562990 PI_562991 PI_562994 PI_562997 PI_562998 PI_563002 PI_563006 PI_563009 PI_563020 PI_563021 PI_563022 PI_563032 PI_563196 PI_563222 PI_563295 PI_563329 PI_563330 PI_563331 PI_563332 PI_563338 PI_563348 PI_563350 PI_563355 PI_564163 PI_566819 PI_568717 PI_569090 PI_569097 PI_569148 PI_569244 PI_569264 PI_569416 PI_569418 PI_569419 PI_569420 PI_569421 PI_569422 PI_569423 PI_569425 PI_569427 PI_569433 PI_569435 PI_569443 PI_569444 PI_569445 PI_569447 PI_569452 PI_569453 PI_569454 PI_569455 PI_569457 PI_569458 PI_569459 PI_569460 PI_569462 PI_569465 PI_569886 PI_570031 PI_570038 PI_570042 PI_570047 PI_570053 PI_570071 PI_570073 PI_570074 PI_570075 PI_570076 PI_570085 PI_570087 PI_570090 PI_570091 PI_570096 PI_570106 PI_570109 PI_570110 PI_570114 PI_570145 PI_570254 PI_570371 PI_570373 PI_570388 PI_570393 PI_570400 PI_570431 PI_573193 PI_576399 PI_576401 PI_583832 PI_585406 PI_585448 PI_585452 PI_585454 PI_585461 PI_585467 PI_585577 PI_585608 PI_585954 PI_585961 PI_585966 PI_586435 PI_586443 PI_586541 PI_593916 PI_619807 PI_619838 PI_620072 PI_620157 PI_63715 PI_641807 PI_641810 PI_641815 PI_641817 PI_641821 PI_641824 PI_641829 PI_641830 PI_641835 PI_641836 PI_641850 PI_641860 PI_641862 PI_641892 PI_641909 PI_642998 PI_643008 PI_643016 PI_646242 PI_646251 PI_646266 PI_651491 PI_651493 PI_651495 PI_651496 PI_651497 PI_653616 PI_653617 PI_655972 PI_655978 PI_655981 PI_655983 PI_656015 PI_656026 PI_656035 PI_656065 PI_92270 PI_329471 PI_329506 PI_329569 PI_337680 PI_452692 PI_455217 PI_152730 PI_329311 NTJ2 M81e CK60B B_Az9504 ICSV700 China 17
This user manual is divided into the following sections:
Data Products: A summary of the available data products and the processes used to create them
Data Access: Instructions for how to access the data products using Clowder, Globus, BETYdb, and CoGe
Description of the scientific objectives and experimental design
Data use policy: Information about data use and attribution
User Tutorials: In-depth examples of how to access and use the TERRA-REF data
Raw output from sensors deployed on Lemnatec field and greenhouse systems, UAVs and tractors
Manually-collected fieldbooks and associated protocols
Derived data, including phenomics data, from computational approaches
Genomic pipeline data
The TERRA-REF reference dataset may be of interest to a variety of research communities including:
Computer vision\/remote sensing\/image analysis (raw sensor data and metadata)
Physiologists (plants and how they are growing)
Robotics (gantry\/location\/orientation)
Breeders (derived traits)
Genomics\/bioinformaticians (genomics data)
This section describes sensor calibration processes and how to access additional information about specific calibration protocols, calibration targets, and associated reference data.
Calibration protocols have been defined by LemnaTec in cooperation with vendors and the TERRA-REF Sensor Steering Committee. Draft calibration protocols are currently in Google Drive and have been incorporated into the LemnaTec Scanalyzer Field sensor documentation.
A detailed calibration process is also provided for the Hyperspectral sensors, with further information below.
The following calibration targets are available:
Aluminum 3D test object
The environmental sensor has been calibrated by LemnaTec. The output of the spectrometer is raw counts, users will need to use the calibration files to convert to units of µW m-2 s-1, taking into account the bandwidth of the chip (0.4nm) if converting to µmol m-2 s-1.
Calibration reference data is available via Globus /sites/ua-mac/EnvironmentLogger/CalibrationData
or in Github Calibrations.zip
Sources:
For the SWIR and VNIR sensors, factory calibration is repeated each year using the calibration lamp provided by Headwall. To convert the hyperspectral exposure image to reflectance requires the wavelength-dependent, factory calibrated reflectance of the spectralon at all VNIR and SWIR wavelengths and a good image of a spectralon panel from each camera. This includes periodic measurements of a white spectralon reflectance panel run with 20ms exposure to match panel calibration.
Dark reference measurement:
VNIR
Dark measurement for VNIR camera is taken at exposure times 20, 25, 30, 35, 40, 45, 50, 55ms.
Data is in the same hypercube format with 180-200 lines, 955 bands, and 1600 pixel samples.
Data is available on Globus in /gantry_data/VNIR-DarkRef/ or via Google Drive.
Measurement was done using Headwall software, so there is no LemnaTec json file.
The name of the folder is the exposure time. "current setting exposure" is showing the exposure time in ms.
Custom workflow to process the calibration files.
SWIR;
Dark counts handled internally, so no calibration files are necessary.
White reference measurement:
VNIR
White measurement for VNIR camera is taken at exposure times 20, 25, 30, 25, 40, 25, 50, 55 ms.
The name of the folder is the exposure time. Data are 1600 sample, 955 bands and 268-298 lines. White reference is located in the lines between 60 to 100 and in the samples between 600 to 1000.
Data is available via Google Drive.
The white reference scans was done at around 1pm ( one hour after solar noon). I don’t see the saturation with 20ms and 25ms exposure time.
For the calibration, this needs to be subtracted from the dark current in the same sample, band and exposure time.
In the following file, I stored an extra file named "CorrectedWhite_raw". This file includes only a single white pixel( one line, one sample) in 955 bands for each exposure time. Data is stored in the similar format but it doesnot include any extra files like frameIndex, image, header ,..
https:\/\/drive.google.com\/file\/d\/0ByXIACImwxA7dVNHa3pTYkFjdWc\/view?usp=sharing
Let me know if you have issue with opening the files.
LemnaTec applied calibration matrix to the 3D scanners.
Source: https://github.com/terraref/computing-pipeline/issues/185
There are calibrated reference panels and blackbody images taken with UAV sensors before and\/or after the each flight mission.
There are also 4 white,grey and black panels laid on the ground during the flight. Knowing the proprieties of these targets would helps us radiometrically correct the UAV images.
What are the reflectance properties of calibrated reference panels for multispectral camera?
What are the thermal properties of reference target for thermal camera?
What are the reflectance properties of the reference panels laid on the ground during the flight?
Is there any other ground truth data collected during the flight for aerial data processing, such as surface reflectance, temperature and other environmental data? These type of data would be helpful for further atmospheric correction.
There are two sets of reference reflectance panels: one that PDS uses, it is small, PDS will need to provide the specs; the second set consists of 4 8m x 8m canvas tarps, nominally 4%, 8%, 48% and 64% reflectance across vnir bands.
We have data from an ASD spectrometer on many but not all flight days that can be used to give the most accurate actual reflectances for each. Kelly Thorp can provide the numbers. The tarps are old and the dark targets are more reflective than nominal and light targets darker than nominal.
The thermal target is a passive black body, I dont know the surface emissivity, it is around 0.97. There are thermistors in the back of the metal plate to provide physical temperature of the body. The black body is stored in a wood box, insulated, to dampen thermal variations. Id guess it is accurate to 2C.
There is a met station on farm for air temperature, humidity, wind speed, wind direction, solar radiation. we have a sun photometer that can be used for atmospheric water vapor content but currently dont deploy it routinely.
No per-wavelength analysis of light produced by the halogen lights is available from the vendor for Showtec 240V\/75W. Measurements are available for a similar halogen bulb Philips Twistline Halogen 230V 50W 18072 in Github: MeasurementPhilipsHalogenSpot.xlsx.
Relative spectral response data is available for the following sensors:
NDVI
PRI
PAR
Where available, per device calibration certificates are included in the Device and Sensor information collections.
Season 1 sorghum (April - July 2016) Season 2 sorghum (August - November 2016) Durum wheat (January 2017 -
Three hundred thirty one lines were planted in Season 1.
Under scanner system
Experiment
Reps
Treatments
Experimental design
BAP
3
30 lines (12 PS, 12 sweet, 6 grain)
RCB with sorghum types nested in groups
Night illumination
3
5 illumination levels x 2 PS lines (with check line separating illumination levels)
RCB
Row #
3
6 adjacent plot scenarios: 3 lines (forage, sweet, PS) x 2 sides (east or west)
RCB but not balanced with all treatments in all reps
Biomass
3
5 sampling times x 3 lines (forage, sweet, PS)
RCB with sampling time as a repeated measure
Density
3
3 densities (5, 15, 30 cm) x 3 lines (forage, sweet, PS)
RCB
RILs
3
130 RILs plus 10 repeats of a single line/rep
Incomplete Block (row-column alpha lattice design)
Uniformity
17
2 lines (forage, PS)
None - Same line planted in single range
West of scanner system
Experiment
Reps
Treatments
Experimental design
BAP
1
30 lines (12 PS, 12 sweet, 6 grain)
None - single rep planted for observation
RILs
3
60 RILs
Incomplete Block (row-column alpha lattice design)
The Lemnatec Scanalyzer Field Gantry System is the largest field crop analytics robot in the world. This high-throughput phenotyping field-scanning robot has a 30-ton steel gantry that autonomously moves along two 200-meter steel rails while continuously imaging the crops growing below it with a diverse array of cameras and sensors.
Twelve sensors are attached to the gantry system. Detailed information for each sensor including name, variable measured, and field of view are available here. The planned sensor missions and their objectives for 2016 are available here.
emergence vigor emergence final stand counts plant heights node and tiller counts on marked plants phenology growth stage data leaf desiccation ratings radiation interception managements Incomplete harvest yield data
One hundred and seventy-six lines were planted in Season 2.
Under scanner system - same as season 1
same as season 1
plant heights managements emergence vigor emergence final stand counts node and tiller counts on marked plants leaf length and width on marked plants, one date
Location: The Automated controlled-environment phenotyping at the Donald Danforth Plant Science Center Bellwether Foundation Phenotyping Facility
The Scanalyzer 3D platform consists of multiple digital imaging chambers connected to the Conviron growth house by a conveyor belt system, resulting in a continuous imaging loop. Plants are imaged from the top and/or multiple sides, followed by digital construction of images for analysis.
RGB imaging allows visualization and quantification of plant color and structural morphology, such as leaf area, stem diameter and plant height.
NIR imaging enables visualization of water distribution in plants in the near infrared spectrum of 900–1700 nm.
Fluorescent imaging uses red light excitation to visualize chlorophyll fluorescence between 680 – 900 nm. The system is equipped with a dark adaptation tunnel preceding the fluorescent imaging chamber, allowing the analysis of photosystem II efficiency.
The LemnaTec software suite is used to program and control the Scanalyzer platform, analyze the digital images and mine resulting data. Data and images are saved and stored on a secure server for further review or reanalysis.
Duration: 10 days on LemnaTec platform
Experimental Design:
3 replicates of 190 BAP lines were grown in a randomized complete block design
Watering regimes = 30% FC and 100% FC
Drought conditions were imposed 10 days after planting
Plants were imaged daily for 10 days (11-20 DAP) and sampled at 20 days after planting
Experiment was repeated twice to phenotype the full BAP (Reps 1A and 1B)
Environment conditions data is collected using the Vaisala CO2, Thies Clima weather sensors as well as lightning, irrigation, and weather data collected at the Maricopa site.
Data formats follow the Climate and Forecast (CF) conventions for variable names and units. Environmental data are stored in the Geostreams database.
WeatherStation coordinates are 33.074457 N, 111.975163 W
EnvironmentLogger is on top of the gantry system and is moveable.
Irrigation is managed at the field level. There are four regions that can be irrigated at different rates.
Level 1 meteorological data is aggregated to from 1 Hz raw data to 5 minute averages or sums.
On Globus or Workbench you can find these data provided in both hourly and daily files. These files contain data at the original temporal resolution of 1/s. In addition, they contain the high resolution spectral radiometer data.
sites/ua-mac/Level_1/envlog_netcdf
hourly files: YYYY-MM-DD_HH-MM-SS_environmentallogger.nc
daily files: envlog_netcdf_L1_ua-mac_YYYY-MM-DD.nc
Data can be accessed using the geostreams API or the PEcAn meteorological workflow. These are illustrated in the sensor data tutorials.
Here is the json representation of a single five-minute observation:
Data can be accessed using the geostreams API or the PEcAn meteorological workflow.
These are illustrated in the sensor data tutorials.
Here is the json representation of a single five-minute observation from Geostreams:
CF standard-name
units
bety
isimip
cruncep
narr
ameriflux
air_temperature
K
airT
tasAdjust
tair
air
TA (C)
air_temperature_max
K
tasmaxAdjust
NA
tmax
air_temperature_min
K
tasminAdjust
NA
tmin
air_pressure
Pa
air_pressure
PRESS (KPa)
mole_fraction_of_carbon_dioxide_in_air
mol/mol
CO2
moisture_content_of_soil_layer
kg m-2
soil_temperature
K
soilT
TS1 (NOT DONE)
relative_humidity
%
relative_humidity
rhurs
NA
rhum
RH
specific_humidity
1
specific_humidity
NA
qair
shum
CALC(RH)
water_vapor_saturation_deficit
Pa
VPD
VPD (NOT DONE)
surface_downwelling_longwave_flux_in_air
W m-2
same
rldsAdjust
lwdown
dlwrf
Rgl
surface_downwelling_shortwave_flux_in_air
W m-2
solar_radiation
rsdsAdjust
swdown
dswrf
Rg
surface_downwelling_photosynthetic_photon_flux_in_air
mol m-2 s-1
PAR
PAR (NOT DONE)
precipitation_flux
kg m-2 s-1
cccc
prAdjust
rain
acpc
PREC (mm/s)
degrees
wind_direction
WD
wind_speed
m/s
Wspd
WS
eastward_wind
m/s
eastward_wind
CALC(WS+WD)
northward_wind
m/s
northward_wind
CALC(WS+WD)
Data is available via Globus or Workbench:
/ua-mac/raw_data/co2sensor
/ua-mac/raw_data/EnvironmentLogger
/ua-mac/raw_data/irrigation
/ua-mac/raw_data/lightning
/ua-mac/raw_data/weather
Description: EnvironmentalLogger raw files are converted to netCDF.
Known issue: the irrigation data stream does not currently handle variable irrigation rates within the field. Specifically, we have not yet accounted for the Summer 2017 drought experiments. See terraref/reference-data#196 for more information.
When the full field is irrigated (as is typical), the irrigated area is 5466.1 m2 (=215.2 m x 25.4 m)
In 2017:
Full field irrigated area from the start of the season to August 1 (103 dap) is 5466.1 m2 (=215.2 m x 25.4 m).
Well-watered treatment zones from August 1 to 15 (103 to 116 dap): 2513.5 m2 (=215.2 m x 11.68 m) in total, combined areas of non-contiguous blocks
Well-watered treatment zones from August 15 - 30 (116 to 131 dap): 3169.9 m2 (=215.2 m x 14.73 m), again in total as the combined areas of non-contiguous blocks
Genomic data includes whole-genome resequencing data from the HudsonAlpha Institute for Biotechnology, Alabama for 384 samples for accessions from the sorghum Bioenergy Association Panel (BAP) and genotyping-by-sequencing (GBS) data from Kansas State University for 768 samples from a population of sorghum recombinant inbred lines (RIL).
Experimental Design:
384 BAP samples were sequenced to an average depth of ~25x.
Shotgun sequencing (127-bp paired-end) was done using an Illumina X10 instrument at the HudsonAlpha Institute for Biotechnology.
Variant calling was done using a computational pipeline at the Danforth Center.
See the Data Products page to get access to raw and derived data products.
Experimental Design:
768 RIL samples were sequenced using a GBS approach.
Fluorescence intensity data is collected using the PSII camera.
Fluorescence intensity data is available via Clowder and Globus:
Clowder: ps2Top collection
Globus path: /sites/ua-mac/raw_data/ps2top
Sensor information: LemnaTec PSII
For details about using this data via Clowder or Globus, please see Data Access section.
Description: Raw image output is converted to a raster format (netCDF\/GeoTIFF)
Output: /sites/ua_mac/Level_1/ps2top
There are 102 bin files. The first (index 0) is an image taken right before the LED are switched on (dark reference). Frame 1 to 100 are the 100 images taken, with the LEDs on. In binary file 102 (index 101) is a list with the timestamps of each frame of the 100 frames.
Right now the LED on timespan is 1s thus the first 50 frames are taken with LEDs on the latter 50 frames with LED off..
The following table lists available TERRA-REF data products. The table will be updated as new datasets are released. Links are provided to pages with detailed information about each data product including sensor descriptions, algorithm (extractor) information, protocols, and data access instructions.
Data product
Description
3D point cloud data (LAS) of the field constructed from the Fraunhofer 3D scanner output (PLY).
Fluorescence intensity imaging is collected using the PSII LemnaTec camera. Raw camera output is converted to (netCDF/GeoTIFF)
Hyperspectral imaging data from the SWIR and VNIR Headwall Inspector sensors are converted to netCDF output using the hyperspectral extractor.
Infrared heat imaging data is collected using FLIR sensor. Raw output is converted to GeoTIFF using the FLIR extractor.
Multispectral data is collected using the PRI and NDVI Skye sensors. Raw output is converted to timeseries data using the multispectral extractor.
Stereo imaging data is collected using the Prosilica cameras. Full-color images are reconstructed in GeoTIFF format using the de-mosaic extractor. A full-field mosaic is generated using the full-field mosaic extractor.
Spectral reflectance data
Spectral reflectance is measured using a Crop Circle active crop canopy sensor
Environment conditions are collected through the CO2 sensor and Thies Clima. Raw output is converted to netCFG using the environmental-logger extractor.
postGIS/netCDF
Phenotype data is derived from sensor output using the PlantCV extractor and imported into BETYdb.
FASTQ and VCF files available via Globus
UAV and Phenotractor
Plot level data available in BETYdb
barcode scanning protractor
barcode scanning ruler
ceptometer (Decagon AccuPAR LP-80)
digital caliper
drying oven
forage chopper
hand shears
infrared thermometer
juice extractor
leaf area meter (Li-Cor 3100, Li-Cor Inc.)
leaf porometer (SC-1 Leaf Porometer, Decagon Devices)
leaf punch
meter stick
paper bags
portable photosynthesis system (Li-Cor 6400, Li-Cor Inc.)
scale
SPAD Meter (SPAD 502 Plus Chlorophyll Meter, Minolta)
spray paint
Variable
Canopy Height
Canopy height for single row of central 2 data rows of 4-row plot. Measured in cm using meter stick, taken at the height representing the plot 'potential', ignoring stunted plants. The canopy height was measured as the height of the foliage (not the inflorescence) at the general top of the canopy where the upper leaves bend and/or establish a canopy surface that would support a very light horizontal object (imagining a light sheet of rigid plastic foam), discounting rare or exceptional leaves in the upper-most 2 or 3 percentile.
Panicle Height
Height of the top of the inflorescence panicle for single central data row of 4-row plot, when panicle extends notably above canopy height.
Seedling Vigor and Emergence
Count the number of emerging seedlings at about 20% emergence, and then repeat every other day until final stand is achieved. A seedling is defined as emerged when the coleoptile is visible above the soil surface. Final stand is defined as when a similar count +/- 5% is achieved on successive counts 1-2 days apart. Count seedlings in the entire plot. Two Alternatives 1. Explicitly count number of plants emerged 2. For each plot, assess % germination in categories (e.g. [0,20], [20,40], …) This is the standard method
Canopy closure and leaf area index
Leaf Architecture / Leaf erectness
Barcode scanning protractor is used to measure youngest fully emerged leaf
Leaf Width
Barcode scanning ruler measured at the widest part of the leaf
Stem number
Manually count the total number of stems in the plot will be counted bi-weekly after thinning for all plants in the plot.
Stem diameter
Stem diameter for each of 10 plants per plot will be measured with a digital caliper at 10 and 150 cm every month. For each plant take a few diameter samples and record the most common value. Use a black sharpie to mark the location at which the sample was taken.
Canopy Height
An "eyeball" estimate of plant height for the entire plot will be taken weekly beginning at the 5-leaf stage. Canopy height, view the canopy horizontally with a measuring stick, taking the height where a light piece of foam would rest on the canopy. Estimate the median height of healthy standing plots, ignoring plants that look really bad (e.g. are lodged). For method development: on subset of plots (10), capture the distribution of heights, e.g. max, min, median, upper and lower quantiles.
Lodging
There are three measures: 1. Percent lodging 0-100 scale 2. Lodging severity 0-100 scale 3. Lodging score 0-100 scale 4. Whether this is stalk or root lodging (categorical 'root', 'stalk') A lodging score will be taken weekly once lodging is observed. The lodging score will be recorded as a percentage and is a combination of the fraction of the plants lodged and the severity of lodging. For example, if 50% of the plants are 50% lodged, then the lodging score would be 25%. The severity of lodging is determined by how far the plants are leaning from vertical. If a plant is laying on the ground the severity of lodging is 100%. If a plant is leaning 45 degrees from vertical, then the severity of lodging is 50%. How to differentiate between stalk lodging and root lodging: scoring 'lodging' implies diagnosing a cause of inclined stems. A better approach may be a visual estimate of a range, with an optional note for root or shoot lodging. Done as deflection from vertical, this might look like:Min_angle Max_angle Loding_type0 1010 4530 60 R20 40 S…Where R = root lodging, S = stem lodging. Since stems are usually curved, the question remains of what reference height to consider?
Above-ground yield
Alleyways will be trimmed by hand with a weed whacker with a blade to accommodate space required between plots for a 2-row forage chopper. Actual plot length will be measured from the first to last stalk cut by the forage chopper. The stalks trimmed by hand will be spray painted to delineate them from stalks in the harvest area. The chopped forage will be weighed in a bag and a 2-quart sample removed for moisture and quality analysis. The sample will be dried in an oven at 65 C until constant weight is achieved. The dried forage will be ground and submitted for quality analysis. Sorghum Checkoff provided 1.5 pg protocol
Total biomass and tissue partitioning
Plants will be (destructively?) sampled (from west of gantry plots?) five times during the season from the 5 leaf stage through final harvest. The area sampled will be 1 meter of row. The plants will be cut off at ground level and immediately placed in a cooled ice chest for transport from the field to the laboratory where they were stored at 5°C until processing.
Allometry
Plant height will be measured from the base of the plant to the point where the top leaf blade is perpendicular to the stem. The number of stems and their average phenological stage will be recorded. Leaves will be removed from the stem at the collar and separated into green and brown leaves.
Leaf Area Index (LAI)
Leaf area of green leaves will be measured with a leaf area meter (Li-Cor 3100, Li-Cor Inc., Lincoln, NE, USA). Heads will be separated from the stems. Stem area will be estimated from stem length (without the head ) x diameter. The stems, brown and green leaves, and heads will be dried separately in an oven at 65°C for 2–4 d and weighed. Leaf area index and stem area index will be calculated.
Specific Leaf Area (SLA)
Specific leaf area will be calculated by dividing green leaf area by green leaf weight.
Phenology
Days to flag leaf emergence
Days to spike emergence
Days to anthesis/flowering
Once anthesis begins, anthesis will be noted 3 times per week until anthesis ends. Anthesis is defined as when 50% of the plants have one or more anthers showing.
Maturity pattern
Once maturity begins, maturity will be noted 3 times per week until maturity ends. Maturity is defined as when 50% of the plants have reached black layer.
Moisture content
Forage moisture content will be determined at final harvest and from the biomass samples by weighing the forage before and after drying in an oven at 65 C for a minimum of 48 h. How large is the sample? ~ 1 pound in a lunchbag, 2 samples per plotHow will it be packaged / labeled?Subsamples?
Lignin content
Determined by NIRS from the moisture sample at final harvest.
BTU/DW
Determined by NIRS from the moisture sample at final harvest.
Juice extraction
Juice will be extracted from stalks from the biomass samples at final harvest using a sweet sorghum mill. The juice will be weighed and brix measured. Brix concentration in the juice – Brix will be measured in the juice extracted as described above.
Plant temperature
A hand-held infrared thermometer will be used to measure plant temperature bi-weekly. A total of 5 readings will be recorded per plot within 2 hours of solar noon.
Plant color
A Minolta SPAD meter will be used to record plant color on plants using the most recently fully expanded leaf on a bi-weekly basis.
Photosynthesis
Using LiCOR 6400, measure A-Ci and A-Q curves to estimate parameters of Collatz model of C4 photosynthesis coupled to the Ball Berry model of stomatal conductance. One reading from the youngest fully expanded leaf. These readings will be taken monthly within 2 hours of solar noon.
Transpiration/stomatal conductance
Stomatal conductance was assessed using a leaf porometer (Decagon Devices, Pullman, WA) by taking 5 readings per plot on most recently fully expanded leaves. Readings will be taken on the 12 photoperiod sensitive lines in the biomass association panel. These readings will be taken bi-weekly and within 2 hours of solar noon at least two times during the season.
Pérez-Harguindeguy N., Díaz S., Garnier E., Lavorel S., Poorter H., Jaureguiberry P., Bret-Harte M. S., CornwellW. K., Craine J. M., Gurvich D. E., Urcelay C., Veneklaas E. J., Reich P. B., Poorter L., Wright I. J., Ray P., Enrico L.,Pausas J. G., de Vos A. C., Buchmann N., Funes G., Quétier F., Hodgson J. G., Thompson K., Morgan H. D., ter Steege H., van der Heijden M. G. A., Sack L., Blonder B., Poschlod P., Vaieretti M. V., Conti G., Staver A. C.,Aquino S., Cornelissen J. H. C. (2013) New handbook for standardised measurement of plant functional traits worldwide. Australian Journal of Botany 61 , 167–234. http://dx.doi.org/10.1071/BT12225
Vanderlip RL. 1993. How a sorghum plant develops. Manhattan, KS, USA: Kansas State University Cooperative Extension. Field Experiments in Crop Physiology. 2013, Jan 13. In PrometheusWiki. Retrieved 15:03,June 21, 2016, from http://www.publish.csiro.au/prometheuswiki/tiki-pagehistory.php?page=Field Experiments in Crop Physiology&preview=41
Photosynthesis / leaf chemistry from hyperspectral data references:
Shawn Serbin et al - Leaf optical properties reflect variation in photosynthetic metabolism and its sensitivity to temperature 2011 J Exp Bot
Additional Draft Protocols are available at https://docs.google.com/document/d/1iP8b97kmOyPmETQI_aWbgV_1V6QiKYLblq1jIqXLJ84/edit#
Several different sensors include geospatial information in the dataset metadata describing the location of the sensor at the time of capture.
Coordinate reference systems The Scanalyzer system itself does not have a reliable GPS unit on the sensor box. There are 3 different coordinate systems that occur in the data:
Most common is EPSG:4326 (WGS84) USDA coordinates
Tractor planting & sensor data is in UTM Zone 12
Sensor position information is captured relative to the southeast corner of the Scanalyzer system in meters
EPSG:4326 coordinates for the four corners of the Scanalyzer system (bound by the rails above) are as follows:
NW: 33° 04.592' N, -111° 58.505' W
NE: 33° 04.591' N, -111° 58.487' W
SW: 33° 04.474' N, -111° 58.505' W
SE: 33° 04.470' N, -111° 58.485' W
In the trait database, this site is named the "MAC Field Scanner Field" and its bounding polygon is "POLYGON ((-111.9747967 33.0764953 358.682, -111.9747966 33.0745228 358.675, -111.9750963 33.074485715 358.62, -111.9750964 33.0764584 358.638, -111.9747967 33.0764953 358.682))"
Scanalyzer coordinates Finally, the Scanalyzer coordinate system is right-handed - the origin is in the SE corner, X increases going from south to north, and Y increases from east to the west.
In offset meter measurements from the southeast corner of the Scanalyzer system, the extent of possible motion for the sensor box is defined as:
NW: (207.3, 22.135, 5.5)
SE: (3.8, 0, 0)
Scanalyzer -> EPSG:4326 1. Calculate the UTM position of known SE corner point 2. Calculate the UTM position of the target point, using SE point as reference 3. Get EPSG:4326 position based on UTM
MAC coordinates Tractor planting data and tractor sensor data will use UTM Zone 12.
Scanalyzer -> MAC Given a Scanalyzer(x,y), the MAC(x,y) in UTM zone 12 is calculated using the linear transformation formula:
Assume Gx = -Gx'
, where Gx'
is the Scanalyzer X coordinate.
MAC -> Scanalyzer
MAC -> EPSG:4326 USDA We do a linear shifting to convert MAC coordinates in to EPSG:4326 USDA
Sensors with geospatial metadata
stereoTop
flirIr
co2
cropCircle
PRI
scanner3dTop
NDVI
PS2
SWIR
VNIR
Available data All listed sensors
stereoTop
cropCircle
co2Sensor
flirIrCamera
ndviSensor
priSensor
SWIR
field scanner plots
There are 864 (54*16) plots in total and the plot layout is described in the plot plan table.
dimension
value
# rows
32
# rows / plot
2
# plots (2 rows ea)
864
# ranges
54
# columns
16
row width (m)
0.762
plot length (m)
4
row length (m)
3.5
alley length (m)
0.5
The boundary of each plot changes slightly each planting season. The scanalyzer coordinates of each row and each range of the two planting seasons is available in the field book. The scanalyzer coordinates of each plot are transformed into the (EPSG:4326) USDA coordinates using the equations above. After that, a polygon of each plot can be generated using ST_GeomFromText funtion and inserted into the BETYdb through SQL statements.
An Rcode is available for generating SQL statements based on the scanalyzer coordinates of each plot, which takes range.csv and row.csv as standard inputs.
The range.csv should be in the following format:
range
x_south
x_north
1
...
...
2
...
...
3
...
...
...
...
...
And the row.csv should look like:
row
y_west
y_east
1
...
...
2
...
...
3
...
...
...
...
...
The output will be something look like:
Infrared heat imaging data is collected collected using the FLIR SC615 thermal sensor. These data are provided as geotiff image raster files as well as plot level means.
Algorithms are in the repository; see the readme for details.
Sensor information:
ua-mac/Level_1/ir_geotiff
To be created
Plot level summaries are named in the trait database. In the future this name will be used for the Level 1 data as well. This name from the Climate Forecast (CF) conventions, and is used instead of 'canopy_temperature' for two reasons: First, because we do not (currently) filter soil in this pipeline. Second, because the CF definition of surface_temperature distinguishes the surface from the medium: "The surface temperature is the temperature at the interface, not the bulk temperature of the medium above or below."
Thermal imaging data is available via Clowder and Globus:
/ua-mac/raw_data/flirIrCamera
Data are unavailable for Season 4 (summer 2017 sorghum) and season 5 (winter 2017-2018 wheat).
3D point cloud data is collected using the Fraunhofer 3D laserscanner. .
Data is available via Clowder and Globus.
Clowder:
Globus path: /sites/ua_mac/raw_data/scanner3DTop
Sensor information:
For details about using this data via Clowder or Globus, please see section.
Raw sensor output (PLY) is converted to LAS format using the ply2las
extractor
Description: PLY data is converted to LAS using the 3D point cloud extractor
Output:
Clowder: LAS file is added to the dataset
Globus: /sites/ua_mac/Level_1/scanner3DTop
Hyperspectral imaging data is collected using the Headwall VNIR and SWIR sensors. In the Nov 2017 Beta Release only VNIR data is provided because we do not have the measurements of downwelling spectral radiation required by the pipeline.
Please see the for more information about how the data are generated and known issues.
See
Hyperspectral data is available via Clowder, , the , and our :
Clowder:
SWIR Collection: Level 1 data not available
Globus and Workbench:
VNIR: /sites/ua-mac/Level_1/vnir_netcdf
SWIR: Level 1 data not available
Sensor information:
Level 2 data are spectral indices computed at the same resolution as Level 1. These can be found in the same Level 1 directories as their parents, but the files are appended *_ind.nc.
To get a list of hyperspectral indices currently generated:
Raw data is available in the filesystem, accessible via Workbench and Globus in the following directories:
VNIR: /sites/ua-mac/raw_data/VNIR
SWIR: /sites/ua-mac/raw_data/SWIR
These files are uncalibrated; see the hyperspectral pipeline repository for information on how these can be processed.
Meteorological data will use conventions. CF is widely used in climate, meteorology, and earth sciences.
Here are some examples (note that we can change from canonical units to match the appropriate scale, e.g. "C" instead of "K"; time can use any base time and time step (e.g. hours since 2015-01-01 00:00:00 UTC
, etc. But the time zone has to be UTC, where 12:00:00 is approx (+/- 15 min). solar noon at Greenwich.
standard_name is CF-convention standard names (except irrigation)
units can be converted by udunits, so these can vary (e.g. the time denominator may change with time frequency of inputs)
Before the Running
The pipepline is developed in Python, so a Python Interpreter is a must. Other than the basic Python standard librarys, the following third-party libraries are required:
netCDF4 for Python
numpy
Other than official CPython interpreter, Pypy is also welcomed, but please make sure that these third-party modules are correctly installed for the target interpreter. The pipeline can only works in Python 2.X versions (2.7 recommended) since numpy does not support Python 3.X versions.
Cloning from the Git:
The extractor for this pipeline is developed and maintained by Max in branch "EnvironmentalLogger-extractor" under the same repository.
Get the Environmental Logger Pipeline to Work
To trigger the pipeline, use the following command:
python ${environmental_logger_source_path}/environmental_logger_json2netcdf.py ${input_JSON_file} ${output_netCDF_file}
Where:
${environmental_logger_source_path}
is where the three environmental_logger files are located
${input_JSON_file}
is where the input JSON files are located
${output_netCDF_file}
is where the users want the pipeline to export the product (netCDF file)
Please note that the parameter for the output file can be a path to either a directory or a file, and it is not necessarily to be existed. If the output is a path to a folder, the final product will be in this folder as a netCDF file that has the same name as the imported JSON file but with a different filename extension (.nc
for standard netCDF file); if this path does not exist, environmental_logger pipeline will automatically make one.
Genomic data includes whole-genome resequencing data from the HudsonAlpha Institute for Biotechnology, Alabama for 384 samples for accessions from the sorghum (BAP) and genotyping-by-sequencing (GBS) data from Kansas State University for 768 samples from a population of sorghum recombinant inbred lines (RIL).
These data are available to Beta Users and require permission to access. The form to sign up for our beta user program is at . Once you have signed up for our beta user program you can access genomics data in one of the following locations:
Download via .
The , which provides container-based computing environments including Jupyter, Rstudio, and Python IDE.
The for download or use within the CyVerse computing environment.
The computing environment.
See before continuing.
The data is structured on both the TERRA-REF strorage (accessible via Globus and Workbench) and CyVerse Data Store infrastructures as follows:
Data derived from analysis of the raw resequencing data at the Danforth Center (version1) are available as gzipped, genotyped variant call format (gVCF) files and the final combined hapmap file.
Combined genotype calls are available in VCF format.
Real-time sensor data transfer by file number and size can be viewed .
See for more information about individual data products and for instructions to access the data products.
Sunfleck ceptometer readings will be taken at least monthly to determine radiation interception and canopy closure. Using e.g. Decagon AccuPAR LP-80. Leaf area index will be calculated using Beer's Law for light extinction. A total of 5 readings will be taken per plot and averaged. Readings will be taken on clear days. Incident light will be measured at least once per rep. NDVI will also be measured weekly using a tractor mounted unit until the tractor can no longer navigate through the field due to the height of the crop. References:Prometheus Wiki
Phenology will be determined according to Vanderlip (1993). Before heading, developmental stages were based on the appearance of the leaf collars. After heading, phenological stages were determined based on the development of the grain. Numbers ranging from 1 (50% of plants heading) to 7 (50% of plants at physiological maturity) were assigned to designate growth stage after the vegetative period. Before heading, growth stages represent mean leaf number of all plants and not the most advanced 50% as was done after headingReference:
For details about using this data via Clowder or Globus, please see section.
Work to recover these data is ongoing; see
Problem description
For details about using this data via Clowder or Globus, please see section.
The calculation in the Environmental Logger is mainly finished by the module under the support of numpy.
Raw data are in bzip2 FASTQ format, one per read pair (*_R1.fastq.bz2 and *_R2.fastq.bz2). 384 samples are available. For a list of the lines sequenced, see the .
Raw data are in gzip FASTQ format. 768 samples are available. For a list of lines sequenced, see the .
CF standard-name
units
time
days since 1700-01-01 00:00:00 UTC
air_temperature
K
air_pressure
Pa
mole_fraction_of_carbon_dioxide_in_air
mol/mol
moisture_content_of_soil_layer
kg m-2
soil_temperature
K
relative_humidity
%
specific_humidity
1
water_vapor_saturation_deficit
Pa
surface_downwelling_longwave_flux_in_air
W m-2
surface_downwelling_shortwave_flux_in_air
W m-2
surface_downwelling_photosynthetic_photon_flux_in_air
mol m-2 s-1
precipitation_flux
kg m-2 s-1
irrigation_flux
kg m-2 s-1
irrigation_transport
kg s-1
wind_speed
m/s
eastward_wind
m/s
northward_wind
m/s
Interested researchers can access BETYdb directly from GIS software such as ESRI ArcMap and QGIS. In some cases direct access can simplify the use of spatial data in BETYdb data, but this convenience must be weighed against a more complex setup, limits of GIS software compatibility, and additional complexity of extracting data from a PostGIS SQL database.
Accessing the production BETYdb used by the TERRA REF program requires creating a secure shell tunnel (SSH) to a remote server. After creating the tunnel, the database is accessed as if it were available on the local machine. A step-by-step process is given below.
ArcMap 10.3 or later (Requires Windows operating system)
Instructions for using QGIS and other GIS software are provided below
PuTTY: ssh client for Windows that can be downloaded here: PuTTY
Request access to the BETYdb server by following the link. This will take you to the NCSA identity service. If you do not have an NCSA account, you will be asked to create one. This account and password will be used to login to the database server. Access will generally be granted within 24-hours.
Use PuTTY or your preferred SSH client and your NCSA account. First open the terminal and then login to bety6.ncsa.illinois.edu using ssh from the command line:
After confirming access to bety6 logout by typing exit
.
The following command will create an SSH tunnel
from your computer to the BETYdb server:
Note if have a postgres running on your desktop computer (using the default port 5432), you will need to stop it first.
The above will bind the local port 5432 (first parameter) to port 5432 (second parameter), the default Postgres listening port, on the remote server. All traffic bound for port 5432 on your local machine will be automatically forwarded to the remote server. As a result, programs such as ArcGIS running on your computer will connect to the remote BETYdb as if it were on your computer.
Note you will need to create the SSH connection with the tunnel every time you wish to access BETYdb from your local machine.
To keep the tunnel open, use
note for PuTTY Users: you can configure Putty to remember these settings. In the navigation tree on the left-hand side, click Connection > SSH > Tunnels. Enter '5432' under Source port and 'localhost:5432' in the Destination field. Then click session and save this configuration for future use.
The next section of the guide will discuss accessing BETYdb using ArcMap, querying plots and joining these to the traits and experiments tables. The instructions for setting up a SSH tunnel will also work psql, pgAdmin3, QGIS, and other clients. Instructions for connecting via QGIS and ArcGIS Pro are provided below.
BETYdb is configured with PostGIS geometry support. This allows ArcGIS Desktop clients to access geometry layers stored within BETYdb.
Warning: ArcGIS releases prior to 10.3 required you to place the PostgreSQL libpq files in the ArcGIS client's bin directory. This is no longer required for the ArcGIS Desktop clients but some ESRI tools may still require the library be installed.*
Click on the ArcCatalog icon (on right edge of ArcMap window) to open the ArcCatalog Tree
In the tree, click on 'Database Connections' and then "Add Database Connnections". A Database Connection dialog window will open.
Within the dialog box:
Click OK
The connection will be saved as "Connection to localhost.sde", right
click and rename to it to "TERRA REF BETYdb trait database" to allow easy reuse.
Click on the Add Layer icon (black cross over yellow diamand) button to open the Add Data dialog window.
Under 'Look in' on the second line choose 'Database Connections'.
Select the "TERRA REF BETYdb trait database" that created above
Select the bety.public.sites table and click 'Add'.
This 'sites' table is the only table in the database with a geospatial 'geometry' data type.
Any of the other tables can also be added, as described below.
The New Query Layer dialog will be displayed asking for the Unique Identifier Field for the layer. For the bety.public.sites table, the unique identifier is the "sitename" field.
Click Finish.
Warning: ArcMap does not support the big integer format used by BETYdb as primary keys and those fields will not be visible or available for selection. In most cases you should be able to use other fields as unique identifiers.*
BETYdb contains one geometry table called betydb.public.sites containing the boundaries for each plot. Because the plot boundaries can change each season, and even within season, different plot definitions may be used (e.g. to subset plots or exclude boundary rows), there is significant overlap that can cause confusion when displayed. In general, you will want to use the query layer to limit plots to a single season and a single definition.
Right click the bety.public.sites layer and choose properties.
Choose the Definition Query tab
Add the line sitename LIKE 'MAC Field Scanner Season 1%'
or sitename LIKE 'MAC Field Scanner Season 2%'
to limit the layer to Season 1 or Season 2 respectively.
Click 'OK'
For more advanced selection of sites by experiment or season, you can join the experiments
and experiments_sites
tables. This is beyond the scope of the present tutorial.
Additional tables can be added and joined to the sites table. Tables can be added just like any other layer. In this case, we'll add bety.public.traits_and_yields_view and join it to the bety.public.sites layer.
To create a join with other tables, start by adding the desired table.
Follow instructions above to add the bety.public.traits_and_yields_view
On this table the unique identifier is a group of columns, so select sitename, cultivar, scientificname, trait, date, entity, and method as the unique identifiers.
Right click on the bety.public.sites layer.
Under 'Joins and Relates' select 'Join'.
Choose sitename (from bety.public.sites) in part 1
Choose bety.public.traits_and_yields_view in part 2
Choose sitename in part 3
Click OK
The final section describes how to create a thematic view of the bety.public.sites layer based on the mean attribute where the trait is NDVI from the bety.public.traits_and_yields_view. Remove any previous joins from bety.public.sites (right click bety.public.sites --> joins and relates --> remove join) prior to performing this procedure because we will be selecting the NDVI data by creating a query layer from bety.public.traits_and_yields_view prior to the join.
Right click bety.public_traits_and_yields_view table and select properties
Click on the Definition Query tab
Add the line "trait = 'NDVI'" to the Definition Query box
Click OK
Follow the steps defined in Joining Additional BETYdb Tables
Right click on the bety.sites layer and choose properties
Choose the Symbology tab
Under the Show section, choose Quantities --> Graduated Colors
Under the Fields Value selection choose mean
Click OK
Below connection instructions assume an SSH tunnel exists.
This assumes you have followed instructions for ArcMAP to create a database connection file.
Open ArcCatalog
Under database connections, you will find the connection made above, called 'TERRA REF BETYdb.sde'
right click this and select 'properties'
copy the file path (it should look like C:\Users\<USER NAME>\AppData\Roaming\ESRI\Desktop10.4\ArcCatalog\TERRA REF BETYdb.sde
Open ArcGIS Pro
Under the Insert tab, select connections --> 'add database'
paste the path to 'TERRA REF BETYdb.sde' in the directory navigation bar
select 'TERRA REF BETYdb.sde'
Open QGIS
In left 'browser panel', right-click the PostGIS icon
select 'New Connection'
Enter connection properties
Name: TERRA REF BETYdb trait database
Service: blank
Host: localhost
Port: 5432
Database: bety
SSL mode: disable
Username: viewer
Password: DelchevskoOro
Options: select 'Also list tables with no geometry'
This does not require GIS software other than the PostGIS traits database. While connecting directly to the database within GIS software is handy, it is also straightforward to export Shapefiles.
After you have connected via ssh to the PostGIS server, the pgsql2shp
function is available and can be used to dump out all of the plot and site definitions (names and geometries) thus:
Clowder is an active data repository designed to enable collaboration around a set of shared datasets. TERRAREF uses Clowder to organize, annotate, and process data generated by phenotyping platforms. Datafiles are available via the Clowder web interface or API.
See the Clowder documentation for more information about the software and its applications.
To create an account, sign up at the TERRA-REF Clowder site and wait for your account to be approved. Once access is granted, you can explore collections and datasets.
Data is organized into spaces, collections, and datasets, collections.
Spaces contain collections and datasets. TERRA-REF uses one space for each of the phenotyping platforms.
Collections consist of one or more datasets. TERRA-REF collections are organized by acquisition date and sensor. Users can also create their own collections.
Datasets consist of one or more files with associated metadata collected by one sensor at one time point. Users can annotate, download, and use these sensor datasets.
Clowder allows users to search metadata and filter datasets and files with particular attributes. Simply enter your search terms in the search box.
Clowder includes support for launching integrated analysis environments from your browser, including RStudio and Jupyter Notebooks.
After selecting a dataset, under the "Analysis Environment Instances", select the "Launch new instance with dataset" drop-down, select the desired tool, then the "Launch" button. Select the "Environment manager" link to view the list of active instances. Find your instance and select the title link. This will display the tool with the selected dataset mounted. If you have a running instance, you can also "Upload dataset to existing instance".
Through it's extractor architecture, Clowder supports automated computational workflows. For more information about developing Clowder extractors, see the Extractor Development documentation
TERRA-REF data is available through four different approaches: Globus Connect, Clowder, BETYdb, and CoGe. Raw data is transfered to the primary compute pipeline using Globus Online. Data is ingested into Clowder to support exploratory analysis. The Clowder extractor system is used to transform the data and create derived data products, which are either available via Clowder or published to specialized services, such as BETYdb.
For more information, see the Architecture Documentation.
Clowder is the primary system used to organize, annotate, and process raw data generated by the phenotyping platforms as well as information about sensors.
Use Clowder to explore the raw TERRA-REF data, perform exploratory analysis, and develop custom extractors.
For more information, see Using Clowder.
Raw data is transferred to the primary TERRA-REF compute pipeline on the Resource Open Geospatial Education and Research (ROGER) system using Globus Online. Data is available for Globus transfer via the Terraref endpoint. Direct access to ROGER is restricted.
Use Globus Online when you want to transfer data from the TERRA-REF system for local analysis.
For more information, see Using Globus.
BETYdb contains the derived trait data with plot locations and other information associated with agronomic experimental design.
Use BETYdb to access about derived trait data.
For more information, see Using BETYdb.
CoGe contains genomic information and sequence data.
For more information, see Using CoGe.
Field protocols
Calibration protocols
Field scanner operational log https://github.com/terraref/computing-pipeline/issues/128
CoGe contains genomic data.
CoGe is a platform for performing Comparative Genomics research. It provides an open-ended network of interconnected tools to manage, analyze, and visualize next-gen data.
Coming soon
The Globus Connect service provides high-performance, secure, file transfer and synchronization between endpoints. It also allows you to securely share your data with other Globus users.
To access data via Globus, you must first have a Globus account and endpoint.
Sign up for Globus at globus.org
To request access to the Terraref endpoint, send your Globus id (or University email) to David LeBauer (dlebauer@illinois.edu) with 'TERRAREF Globus Access Request' in the subject. You will be notified once you have been granted access.
To transfer data to your computer or server:
Log into Globus https://www.globus.org
Add an endpoint for the destination (e.g. your local computer) https://www.globus.org/app/endpoints/create-gcp
Go to the 'transfer files' page: https://www.globus.org/app/transfer
Select source
Endpoint: Terraref
Path: Navigate to the subdirectory that you want.
Select (click) a folder
Select (highlight) files that you want to download at destination
Select the endpoint that you set up above of your local computer or server
Select the destination folder (e.g. /~/Downloads/)
Click 'go'
Files will be transfered to your computer
Globus Getting Started
We plan to make data from the Transportation Energy Resources from Renewable Agriculture Phenotyping Reference Platform (TERRA-REF) project available for use with attribution. Each type of data will include or point to the appropriate attribution policy.
We plan to release the data in stages or tiers. For pre-release access please complete the alpha tester application.
The first tier will be an internal release to the TERRA-REF team and the standards committee. This first tier release will be to initially quality check and calibrate the data and will take place as data sets are produced and compiled.
By November 2016, it is an objective of the TERRA-REF team to establish a data release pipeline, wherein the release of data to this first tier will be within 21 days from the date of collection.
Access to the data will be arranged for by the resource producer (i.e. limiting access to selected users).
The second tier will enable the release of the data generated solely by the TERRA-REF team to other TERRA teams as well as non-TERRA entities.
By November 2017, it is an objective of the TERRA-REF team to establish a data release pipeline, wherein the release of data to this second tier will be within 10 days from the data of collection.
It is noted that release of the data to the second tier may occur prior to publication and that access is granted with the understanding that the contributions and interests of the TERRA-REF team should be recognized and respected by the users of the data. The TERRA-REF team reserves the right to analyze and published its own data. Resource users should appropriately cite the source of the data and acknowledge the resource produces. The publication of the data, as suggested in the TERRA-REF Authorship Guidelines, should specify the collaborative nature of the project, and authorship is expected to include all those TERRA-REF team members contributing significantly to the work.
Access to the data will be determined by the resource producers and may be governed by separate license or other agreements. 1. iii)It is an objective of the TERRA-REF team to enable the release of the data to the public by November 2018 but no later than the date of close-out of the awarded funds.
Genomic data for the Sorghum bicolor Bioenergy Association Panel (BAP) from the TERRA-REF project is available pre-publication to maximize the community benefit of these resources. Use of the raw and processed data that is available should follow the principles of the Fort Lauderdale Agreement and the Department of Energy's Joint Genome Institute (JGI) early release policies.
By accessing these data, you agree not to publish any articles containing analyses of genes or genomic data on a whole genome or chromosome scale prior to publication by TERRA-REF and/or its collaborators of a comprehensive genome analysis ("Reserved Analyses"). "Reserved analyses" include the identification of complete (whole genome) sets of genomic features such as genes, gene families, regulatory elements, repeat structures, GC content, or any other genome feature, and whole-genome- or chromosome-scale comparisons with other species. The embargo on publication of Reserved Analyses by researchers outside of the TERRA-REF project is expected to extend until the publication of the results of the sequencing project is accepted. Scientific users are free to publish papers dealing with specific genes or small sets of genes using the sequence data. If these data are used for publication, the following acknowledgment should be included: 'These sequence data were produced by the US Department of Energy Transportation Energy Resources from Renewable Agriculture Phenotyping Reference Platform (TERRA-REF) Project'. These data may be freely downloaded and used by all who respect the restrictions in the previous paragraphs. The assembly and sequence data should not be redistributed or repackaged without permission from TERRA-REF. Any redistribution of the data during the embargo period should carry this notice: "The TERRA-REF project provides these data in good faith, but makes no warranty, expressed or implied, nor assumes any legal liability or responsibility for any purpose for which the data are used. Once the sequence is moved to unreserved status, the data will be freely available for any subsequent use."
We prefer that potential users of these sequence data contact the individuals listed under Contacts with their plans to ensure that proposed usage of sequence data are not considered Reserved Analyses.
For algorithms, we intend to release via MIT or MIT compatible license (e.g. BSD, UIUC/NCSA, Apache v2).
For other raw data, such as phenotypic data and associated metadata, we intend to release via Creative Commons with Attribution (CC by 4.0).
Todd Mockler, Project/Genomics Lead (email: tmockler AT danforthcenter DOT org)
David LeBauer, Computing Pipeline Lead (email: dlebauer AT illinois DOT edu)
Erica Fishel, Technology Transfer Lead (email: efischel AT danforthcenter DOT org)
Nadia Shakoor, Associate Project Director (email: nshakoor AT danforthcenter DOT org)
The willingness of many scientists to cooperate and collaborate is what makes TERRA REF possible. Because the platform encompasses a diverse group of people and relies on many data contributors to create datasets for analysis, writing scientific papers can be more challenging than with more traditional projects. We have attempted to lay out ground rules to establish a fair process for establishing authorship, and to be inclusive while not diluting the value of authorship on a manuscript. Please engage with the TERRA REF manuscript writing process knowing you are helping to forge a new model of doing collaborative scientific research.
This document is based on the Nutrient Network Authorship Guidelines, http://nutnet.org/authorship and used with permission. Described in Borer, Elizabeth T., et al. "Finding generality in ecology: a model for globally distributed experiments."; Methods in Ecology and Evolution 5.1 (2014): 65-73.
We plan to quickly make data and software available for use with attribution, under CC-By 4.0, MIT compatable license, or Ft. Lauderdale Agreement as described in our Data Use Guidelines. Such data can be used with attribution (e.g. citation); co-authorship opportunities are welcome where warranted (see below) by specific contributions to the manuscript (e.g. help in interpreting data beyond technical support).
We are making data available early for users under the condition that manuscripts led within the team not be scooped. In these cases, people who wish to use the data for publication prior to official open release date of November 2018 should coordinate co-authorship with the person responsible for collecting the data.
Our primary goals in the TERRA REF authorship process are to consistently, accurately and transparently attribute the contribution of each author on the paper, to encourage participation in manuscripts by interested scientists, and to ensure that each author has made sufficient contribution to the paper to warrant authorship.
Steps:
Read these authorship policies and guidelines.
Consult the current list of manuscripts (http://terraref.org/manuscripts) for current proposals and active manuscripts, contact the listed lead author on any similar proposal to minimize overlap, or to join forces. Also carefully read these guidelines.
Prepare a manuscript proposal. Your proposal will list the lead author(s), the title and abstract body, and the specific data types that you will use. You can also specify more detail about response and predictor variables (if appropriate), and indicate a timeline for analysis and writing. Submit your proposal through this form.
Proposed ideas are reviewed by the authorship committee primarily to facilitate appropriate collaborations, identify potential duplication of effort, and to support the scientists who generate data while allowing the broader research community access to data as quickly and openly as possible. The authorship committee may suggest altering or combining analyses and papers to resolve issues of overlap.
Circulate your draft analysis and manuscript to solicit Opt-In authorship.
For global analyses, the lead author should circulate the manuscript to the Network by submitting a email to the TERRA REF listserv (to be determined @ terraref.org).
For analyses of more limited scope, the lead author should circulate the manuscript to network collaborators who have indicated interest at the abstract stage, those who have contributed data, and any others who the lead author deems appropriate.
In both cases, the subject line of the email should include the phrase "OPT-IN PAPER"; This email should also include a deadline by which time co-authors should respond.
The right point to share your working draft and solicit co-authors is different for each manuscript, but in general:
sharing early drafts or figures allows for more effective co-author contribution. While ideally this would mean circulating the manuscript at a very early stage for opt-in to the entire network, it is acceptable and even typical to share early drafts or figures among a smaller group of core authors.
circulating essentially complete manuscripts does not allow the opportunity for meaningful contribution from co-authors, and is discouraged.
Potential co-authors should signal their intention to opt-in by responding by email to the lead author before the stated deadline.
Lead authors should keep an email list of co-authors and communicate regularly about progress including sharing drafts of analyses, figures, and text as often as is productive and practical.
Lead authors should circulate complete drafts among co-authors and consider comments and changes. Given the wide variety of ideas and suggestions provided on each TERRA REF paper, co-authors should recognize the final decisions belong to the lead author.
Final manuscripts should be reviewed and approved by each co-author before submission.
All authors and co-authors should fill out their contribution in the authorship rubric and attach it as supplementary material to any TERRA REF manuscript. Lead authors are responsible for ensuring consistency in credit given for contributions, and may alter co-author's entries in the table to do so.
The authorship rubric provides a framework for this process.
Note that the last author position may be appropriate to assign in some cases. For example, this would be appropriate for advisors of lead authors who are graduate students or postdocs and for papers that two people worked very closely to produce.
The lead author should carefully review the authorship contribution table to ensure that all authors have contributed at a level that warrants authorship and that contributions are consistently attributed among authors. Has each author made contributions in at least two areas in the authorship rubric? Did each author provide thoughtful, detailed feedback on the manuscript? Authors are encouraged to contact the TERRA REF PI (Mockler) or authorship committee (Jeff White, Geoff Morris, Todd Mockler, David LeBauer, Wasit Wulamu, Nadia Shakoor) about any confusion or conflicts.
Authorship must be earned through a substantial contribution. Traditionally, project initiation and framing, data analysis and interpretation, and manuscript preparation are all authorship-worthy contributions, and remain so for TERRA REF manuscripts. However, TERRA REF collaborators have also agreed that collaborators who lead a site from which data are being used in a paper can also opt-in as co-authors, under the following conditions: (1) the collaborators' site has contributed data being used in the paper's analysis; and (2) that this collaborator makes additional contributions to the particular manuscript, including data analysis, writing, or editing. For coauthorship on opt-out papers, each individual must be able to check at least two boxes in the rubric, including contribution to the writing process. These guidelines apply equally to manuscripts led by graduate students.
Manuscripts published by TERRA REF will be accompanied by a supplemental table indicating authorship contributions. You can copy and share the authorship rubric. For opt-in papers, a co-author is expected to have at least two of the following areas checked in the authorship rubric.
rubric item
example contribution meriting a checked box
Developed and framed research question(s)
Originated idea for current analysis of TERRA REF data; contributed significantly to framing the ideas in this analysis at early stage of manuscript
Analyzed data
Generated models (conceptual, statistical and/or mathematical), figures, tables, maps, etc.; contributed key components to the computing pipeline.
Contributed Data
generated a dataset being used in this manuscript's analysis.
Contributed to data analyses
Provided comments, suggestions, and code for data analysis
Wrote the paper
Wrote the majority of at least one of the sections of the paper
Contributed to paper writing
Provided suggestions such as restructuring ideas, text and citations linking to new literature areas, copy editing
Site level coordinator
Coordinated data collection, proofing, and submission of unreleased data for at least one site used in this manuscript.
Members: David LeBauer, Todd Mockler, Geoff Morris, Nadia Shakoor, Jeff White, Wasit Wulamu
The publications committee ensures communication across projects to avoid overlap of manuscripts, works to provide guidance on procedures and authorship guidelines, and serves as the body of last resort for resolution of authorship disputes within the Network.
Please use the following text in the acknowledgments of TERRA REF manuscripts:
The [information / data / work] presented here is from the TERRA REF experiment, funded by the Advanced Research Projects Agency-Energy (ARPA-E), U.S. Department of Energy, under Award Number DE-AR0000594. The views and opinions of authors expressed herein do not necessarily state or reflect those of the United States Government or any agency thereof.
Please use "TERRA REF"; as one of your keywords on submitted manuscripts, so that TERRA REF work is easily indexed and searchable.
The Analysis Workbench allows you to launch private Jupyter Notebook and RStudio instances to explore and analyze TERRA-REF data products.
To create an account, sign up at the TERRA-REF Analysis Workbench site and wait for your account to be approved. Once access is granted, you can launch analysis environments.
Each user has a "home" directory mounted into the analysis tools under /home/userid. This is read-write scratch space.
Data access is provided via a read-only NFS mount to the TERRA-REF dataset on ROGER. The data is mounted to each container under /data/terraref and linked to the analysis environment working directory. For example, in Jupyter this is /home/jovyan/work/data.
We will release the data in stages or tiers.
The first tier will be an internal release to the TERRA-REF team and the standards committee. This first tier release will be to initially quality check and calibrate the data and will take place as data sets are produced and compiled.
By November 2016, it is an objective of the TERRA-REF team to establish a data release pipeline, wherein the release of data to this first tier will be within 21 days from the date of collection.
Access to the data will be arranged for by the resource producer (i.e. limiting access to selected users).
The second tier will enable the release of the data generated solely by the TERRA-REF team to other TERRA teams as well as non-TERRA entities.
By November 2017, it is an objective of the TERRA-REF team to establish a data release pipeline, wherein the release of data to this second tier will be within 10 days from the data of collection.
It is noted that release of the data to the second tier may occur prior to publication and that access is granted with the understanding that the contributions and interests of the TERRA-REF team should be recognized and respected by the users of the data. The TERRA-REF team reserves the right to analyze and published its own data, provided that this is done in a timely fashion. Resource users should appropriately cite the source of the data and acknowledge the resource produces. The publication the data, as suggested in the TERRA-REF Authorship Guidelines, should specify the collaborative nature of the project, and authorship is expected to include all those contributing significantly to the work.
Access to the data will be determined by the resource producers and may be governed by separate license or other agreements.
It is an objective of the TERRA-REF team to enable the release of the data to the public by November 2018 but no later than the date of close-out of the awarded funds.
BETYdb is used to manage and distribute agricultural and ecological data. It contains phenotype and agronomic data including plot locations and other geolocations of interest (e.g. fields, rows, plants).
To request access to BETYdb, register on the BETYdb web site. You will be notified once you have been granted access.
The primary BETYdb Data Access Guide is largely relevant here, noting the following usages:
Genotypes are stored in the cultivars
table
Plots are stored in the sites
table. Plots are nested hierarchically based on geolocation.
Most tables in BETYdb have search boxes. We describe below how to use the Advanced Search box to query data from these tables and download the results as a CSV file.
The Advanced Search box is the easiest way to download summary datasets designed to have enough information (location, time, species, citations) to be useful for a wide range of use cases.
(For more information about querying data from specific tables, see the BETYdb Data Access Guide.)
On the Welcome page of BETYdb there is a search option for trait and yield data (Figure 1). This tool allows users to search the entire collection of trait and yield data for specific sites, citations, species, and traits.
The results page provides a map interface and the option to download a file containing search results. The downloaded file is in CSV format. This file provides meta-data and provenance information, including the SQL query used to extract the data, the date and time the query was made, the citation source of each result row, and a citation for BETYdb itself.
Using the search box to search trait and yield data is very simple: Type the site (city or site name), species (scientific or common name), cultivar, citation (author and/or year), or trait (variable name or description) into the search box and the results will show contents of BETYdb that match the search. The number of records per page can be changed to accord with the viewer's preference and the search results can be downloaded in the Excel-compatible CSV format.
The search map may be used in conjunction with search terms to restrict search results to a particular geographical area—or even a specific site—by clicking on a map. Clicking on a particular site will restrict results to that site. Clicking in the vicinity of a group of sites but not on a particular site will restrict the search to the region around the point clicked. Alternatively, if a search using search terms is done without clicking on the map, all sites associated with the returned results are highlighted on the map. Then, to zero in on results for a particular geographic area, click on or near highlighted locations on the map.
Produced with Gitbook version
The Standards Committee is responsible for defining and advising the development of data products and access protocols for the ARPA-E TERRA program. The committee consists of twelve core participants: one representative from each of the six funded projects and six independent experts. The committee will meet virtually each month and in person each year to discuss, develop, and revise data products, interfaces, and computing infrastructure.
TERRA Project Standards Committee representatives are expected to represent the interests of their TERRA team, their research community, and the institutions for which they work. External participants were chosen to represent specific areas of expertise and will provide feedback and guidance to help make the TERRA platform interoperable with existing and emerging sensing, informatics, and computing platforms.
Participate in monthly to quarterly teleconferences with the committee.
Provide expert advice.
Provide feedback from other intersted parties.
Participate in, or send delegate to, annual two-day workshops.
If we can efficiently agree on and adopt conventions, we will have more flexibility to use these workshops to train researchers, remove obstacles, and identify opportunities. This will be an opportunity for researchers to work with developers at NCSA and from the broader TERRA informatics and computing teams to identify what works, prioritize features, and move forward on research questions that require advanced computing.
August 2015: Establish committee, form a data plan
January 2016: v0 file standards
January 2017: v1 file standards, sample data sets
January 2018: mock data cube generator, standardized data products, simulated data
January 2019: standardized data products, simulated data
TERRA Project Representatives (6)
ARPA-E Program Representatives (2)
Board of External Advisors (6)
(numbers in parentheses are targets, for which we have funding)
In the TERRA-REF release, sensor metadata is generally stored and exchanged using formats defined by LemnaTec. Sensor metadata is stored in metadata.json
files for each dataset. This information is ingested into Clowder and available via the "Metadata" tab .
Manufacturer information about devices and sensors are available via Clowder in the collection. This collection includes datasets representing each sensor or calibration target containing specifications\/datasheets, calibration certificates, and associated reference data.
Fixed metadata
Authoritative fixed sensor metadata is available for each of the sensor datasets. This has been extended to include factory calibrated spectral response and relative spectral response information. For more information, please see the repository on Github.
Runtime metadata
Runtime metadata for each sensor run is stored in the metadata.json
files in each sensor output directory.
Reference data
Additional reference data is available for some sensors:
Factory calibration data for the LabSphere and SphereOptics calibration targets.
Relative spectral response (RSR) information for sensors
Calibration data for the environmental logger
Dark\/white reference data for the SWIR and VNIR sensors.
The TERRA-REF team is currently investigating available standards for the representation of sensor information. Preliminary work has been done using OGC SensorML vocabularies in a custom JSON-LD context. For more information, please see the repository on Github.
is a National Science Foundation funded cyberinfrastructure that aims to democratize access to supercomputing capabilities.
TERRA-REF genomics data is accessible on the CyVerse Data Store and Discovery Environment. Accessing data through the CyVerse Discovery Environment requires signing up for a free CyVerse account. The Discovery Environment gives users access to software and computing resources, so this method has the advantage that TERRA-REF data can be utilized directly without the need to copy the data elsewhere. During the TERRA-REF , users will need to request access to the TERRA-REF CyVerse Community Data folder through the TERRA-REF . The TERRA-REF Community Data folder can be found at /iplant/home/shared/terraref
.
The data processing pipeline transmits data from origination sites to a controlled directory structure on the CyberGIS supercomputer.
The data is generally structured as follows:
...where raw outputs from sensors per site are stored in a raw_data
subdirectory and corresponding outputs from different extractor algorithms are stored in Level_1
(and eventually Level_2
, etc) subdirectories.
When possible, sensor directories will be divided into days and then into individual datasets.
This directory structure is visible when accessing data via the Globus interface.
Genomic data have reached a high level of standardization in the scientific community. Today, all high-impact journals typically ask the author to deposit their genomic data in either or both of these databases before publication.
Below are the most widely accepted formats that are relevant to the data and analyses generated in TERRA-REF.
Raw reads + quality scores are stored in . FASTQ files can be manipulated for QC with
Reference genome assembly (for alignment of reads or BLAST) is in . FASTA files generally need indexing and formatting that can be done by aligners, BLAST, or other applications that provide built-in commands for this purpose.
Sequence alignments are in BAM format – in addition to the nucleotide sequence, the BAM format contains fields to describe mapping and read quality. BAM files are binary files but can be visualized with . If needed, BAM can be converted in SAM (text file) with
BAM is the preferred format for sra database (sequence read archive).
SNP and genotype variants are in . VCF contains all information about read mapping and SNP and genotype calling quality. VCF files are typically manipulated with
VCF format is also the format required by dbSNP, the largest public repository all SNPs.
In TERRA-REF v0 release, agronomic and phenotype data is stored and exchanged using the . Agronomic data is stored in the sites
, managements
, and treatments
tables. Phenotype data is stored in the traits
, variables
, and methods
tables. Data is ingested and accessed via the BETYdb API formats.
In cooperation with participants from , the , and groups, the TERRA-REF team is pursuing the development of a format to facilitate the exchange of data across systems based on the ICASA Vocabulary and AgMIP JSON Data Objects. An initial draft of this format is available for comment on
In addition, we plan to enable the TERRA-REF databases to import and export data via the .
Genomic coordinates are given in a BED format – gives the start and end positions of a feature in the genome (for single nucleotides, start = end). can be edited with .
Name
Institution
Coordinators
David Lee
ARPA-E
david.lee2_at_hq.doe.gov
David LeBauer
UIUC / NCSA
dlebauer_at_illinois.edu
TERRA Project Representatives
Paul Bartlett
Near Earth Autonomy
paul_at_nearearthautonomy.com
Jeff White
USDA ALARC
Jeffrey.White_at_ars.usda.gov
Melba Crawford
Purdue
melbac_at_purdue.edu
Mike Gore
Cornell
mag87_at_cornell.edu
Matt Colgan
Blue River
matt.c_at_bluerivert.com
Christer Janssen
Pacific Northwest National Laboratory
georg.jansson_at_pnnl.gov
Barnabas Poczos
Carnegie Mellon
bapoczos_at_cs.cmu.edu
Alex Thomasson
Texas A&M University
thomasson_at_tamu.edu
External Advisors
Cheryl Porter
ICASA / AgMIP / USDA
Shawn Serbin
Brookhaven National Lab
sserbin_at_bnl.gov
Shelly Petroy
NEON
spetroy_at_neoninc.org
Christine Laney
NEON
claney_at_neoninc.org
Carolyn J. Lawrence-Dill
Iowa State
triffid_at_iastate.edu
Eric Lyons
University of Arizona / iPlant
ericlyons_at_email.arizona.edu
TERRA’s data standards facilitate the exchange of genomic and phenomic data across teams and external researchers. Applying common standards makes it easier to exchange analytical methods and data across domains and to leverage existing tools.
When practical, existing conventions and standards have been used to create data standards. Spatial data adopts Federal Geographic Data Committee (FGDC) and Open Geospatial Consortium (OGC) data and meta-data standards. CF variable naming convention was adopted for meteorological data and biophysical data. Data formats and variable naming conventions were adapted from NEON and NASA.
Feedback from data creators and users were used to define the types of data formats, semantics, and interfaces, file formats, and representations of space, time, and genetic identity based on existing standards, commonly used file formats, and user needs.
We anticipate that standards and data formats will evolve over time as we clarify use cases, develop new sensors and analytical pipelines, and build tools for data format conversion and feature extraction and tracking provenance. Each year we will re-convene to assess our standards based on user needs. The Standards Committee will assess the trade-off between the upfront cost of adoption with the long-term value of the data products, algorithms, and tools that will be developed as part of the TERRA program. The specifications for these data products will be developed iteratively over the course of the project in coordination with TERRA funded projects. The focus will be to take advantage of existing tools based on these standards, and to develop data translation interfaces where necessary.
Several extractors push data to the Clowder Geostreams API, which allows registration of data streams that accumulate datapoints over time. These streams can then be queried, visualized and downloaded to get time series of various measurements across plots and sensors.
TERRA-REF organizes data into three levels:
Location (e.g. plot, or a stationary sensor)
Information stream (a particular instrument's data, or a subset of one instrument's data)
Datapoint (a single observation from the information stream at a particular point in time)
Here, the various streams that are used in the pipeline and their contents are listed.
Location group
Stream name
Datapoint property [units / sample value]
...
Full Field (Environmental Logger)
Weather Observations
sunDirection [degrees / 358.4948271126]
airPressure [hPa / 1014.1764580218]
brightness [kilo Lux / 1.0607318339]
relHumidity [relHumPerCent / 19.3731498154]
temperature [DegCelsuis / 17.5243385113]
windDirection [degrees / 176.7864009522]
precipitation [mm/h / 0.0559327677]
windVelocity [m/s / 3.4772789697]
raw values shown here; check if extractor converts to SI units
Photosynthetically Active Radiation
par [umol/(m^2*s) / 0]
co2 Observations
co2 [ppm / 493.4684409718]
Spectrometer Observations
maxFixedIntensity [16383]
integration time in us [5000]
wavelength [long array of decimals]
spectrum [long array of decimals]
AZMET Maricopa Weather Station
Weather Observations
wind_speed [1.089077491]
eastward_wind [-0.365913231]
northward_wind [-0.9997966834]
air_temperature [Kelvin/301.1359779]
relative_humidity [60.41579336]
preciptation_rate [0]
surface_downwelling_shortwave_flux_in_air [43.60608856]
surface_downwelling_photosynthetic_photon_flux_in_air [152.1498155]
Irrigation Observations
flow [gallons / 7903]
UIUC Energy Farm - CEN
UIUC Energy Farm - NE
UIUC Energy Farm - SE
Energy Farm Observations - CEN/NE/SE
wind_speed
eastward_wind
northward_wind
air_temperature
relative_humidity
preciptation_rate
surface_downwelling_shortwave_flux_in_air
surface_downwelling_photosynthetic_photon_flux_in_air
air_pressure
PLOT_ID e.g. Range 51 Pass 2 (each plot gets a separate location group)
sensorName - Range 51 Pass 2 (each sensor gets a separate stream within the plot)
fov [polygon geometry]
centroid [point geometry]
canopycover - Range 51 Pass 2
canopy_cover [height/0.294124289126]
Environmental Sensors Log of files transfered from Arizona to NCSA
Transferring ima
Data is sent to the gantry-cache server located inside the main UA-MAC building's telecom room via FTP over a private 10GbE interface. Path to each file being transferred is logged to /var/log/xferlog. Docker container running on the gantry-cache reads through this log file, tracking the last line it has read and scans the file regularly looking for more lines. File paths are scraped from the log and are bundled into groups of 500 to be transferred to the Spectrum Scale file systems that backs the ROGER cluster at NCSA via the Globus Python API. The log file is rolled daily and compressed to keep size in check. Sensor directories on the gantry-cache are white listed for being monitored to prevent accidental or junk data from being ingested into the Clowder pipeline.
A Docker container in the terra-clowder VM running in ROGER's Openstack environment gets pinged about incoming transfers and watches for when they complete, once completed the same files are queued to be ingested into Clowder.
Once files have been successfully received by the ROGER Globus endpoint, the files are then removed from the gantry-cache server by the Docker container running on the gantry-cache server. A clean up script walks the gantry-cache daily looking for files older than two days that have not been transferred and queues any if found.
Transferring images
Processes at Danforth monitor the database repository where images captured from the Scanalyzer are stored. After initial processing, files are transferred to NCSA servers for additional metadata extraction, indexing and storage.
At the start of the transfer process, metadata collected and derived during Danforth's initial processing will be pushed.
The current "beta" Python script can be viewed on GitHub. During transfer tests of data from Danforth's sorghum pilot experiment, 2,725 snapshots containing 10 images each were uploaded in 775 minutes (3.5 snapshots\/minute).
Transfer volumes
The Danforth Center transfers approximately X GB of data to NCSA per week.
Blue Waters Nearline: NCSA 300PB+ Tape Archive (2PB Allocation)
ROGER: CyberGIS R&D server for GIS applications, 5PB storage + variety of nodes, including large memory. roger.ncsa.illinois.edu (1PB Allocation)
Outlined below are the steps taken to create a raw vcf file from paired end raw FASTQ files. This was done for each sequenced accession so a HTCondor DAG Workflow was written to streamline the processing of those ~200 accessions. While some cpu and memory parameters have been included within the example steps below those parameters varied from sample to sample and the workflow has been honed to accomodate that variation. This pipeline is subject to modification based on software updates and changes to software best practices.
Download Sorghum bicolor v3.1 from Phytozome
Generate:
Above this point is the workflow for the creation of the gVCF files for this project. The following additional steps were used to create the Hapmap file
NOTE: This project has 363 gvcfs: multiple instances of CombineGVCFs, with unique subsets of gvcf files, were run in parallel to speed up this step below are examples
TERRA members may submit data to Clowder, BETYdb, and CoGe.
Clowder contains data related to the field scanner operations and sensor box, including bounding box of each image / dataset as well as location of the sensor, data types and processing level, scanner missions.
BETYdb contains plot locations and other geolocations of interest (e.g. fields, rows, plants) that are associated with agronomic experimental design / meta-data (what was planted where, field boundaries, treatments, etc).
CoGe contains genomic data.
They may also develop extractors - services that run silently alongside Clowder.
The Lemnatec Scanalyzer Field Gantry System
Sensor missions
Scientific Motivation
What sensors, how often etc.
Tractor
UAV
Manually Collected Field Data
https://docs.google.com/document/d/1iP8b97kmOyPmETQI_aWbgV_1V6QiKYLblq1jIqXLJ84/edit#heading=h.3w6iuawxkjl6 https://github.com/terraref/reference-data/issues/45
The Scanalyzer 3D platform consists of multiple digital imaging chambers connected to the Conviron growth house by a conveyor belt system, resulting in a continuous imaging loop. Plants are imaged from the top and/or multiple sides, followed by digital construction of images for analysis.
RGB imaging allows visualization and quantification of plant color and structural morphology, such as leaf area, stem diameter and plant height.
NIR imaging enables visualization of water distribution in plants in the near infrared spectrum of 900–1700 nm.
Fluorescent imaging uses red light excitation to visualize chlorophyll fluorescence between 680 – 900 nm. The system is equipped with a dark adaptation tunnel preceding the fluorescent imaging chamber, allowing the analysis of photosystem II efficiency.
Capturing images
The LemnaTec software suite is used to program and control the Scanalyzer platform, analyze the digital images and mine resulting data. Data and images are saved and stored on a secure server for further review or reanalysis.
You can read more about the Danforth Plant Sciences Center Bellwether Foundation Phenotyping Facility on the DDPSC website.
This page summarizes existing standards, conventions, controlled vocabularies, and ontologies used for the representation of crop physiological traits, agronomic metadata, sensor output, genomics, and other inforamtion related to the TERRA-REF project.
The ICASA Version 2.0 data standard defines an abstract model and data dictionary for the representation of agricultural field expirements. ICASA is explicitly designed to support implementations in a variety of formats, including plain text, spreadsheets or structured formats. It is important to note that ICASA is both the data dictionary and a format used to describe experiments.
The Agricultural Model Intercomparison Project () project has developed a for use with the AgMIP Crop Experiment (ACE) database and API.
Currently, the ICASA data dictionary is represented as a and is not suitable for linked-data applications. The next step is to render ICASA in RDF for the TERRA-REF project. This will allow TERRA-REF to produce data that leverages the ICASA vocabulary as well as other external or custom vocabularies in a single metadata format.
The ICASA data dictionary is also being mapped to various ontologies as part of the project. With this, it may be possible in the future to represent ICASA concepts using formal ontologies or to create mappings/crosswalks between them.
See also:
White et al (2013). . Computers and Electronics in Agriculture.
AgMIP
</small>
MIAPPE was developed by members of the European Phenotyping Network (EPPN) and the EU-funded project. It is intended to define a list of attributes necessary to fully describe a phenotyping experiment.
The MIAPPE standard is available from the transPlant and is compatible with the framework. The transPLANT standards portal also provides example configuration for the ISA toolset.
MIAPPE is based on the ISA framework, building on earlier “minimum information” standards, such as MIAME (Minimum Information about a Microarray Experiment). If the MIAPPE standard is determined to be useful for TERRA-REF, it would be worth reviewing the MIAME steandard and related formats such as MAGE-TAG, MINiML, and SOFT accepted by the Gene Expression Omnibus (GEO). GEO is a long-standing repository for genetic research data and might serve as another model for TERRA-REF.
See also:
</small>
See also:
</small>
The Crop Ontology curation tool supports import and export of trait information in a trait dictionary format.
See also:
</small>
This section reviews related controlled vocabularies, data dictionaries, and ontologies.
While BETYdb is not a controlled vocabulary itself, the relational schema models a variety of concepts including managements, sites, treatments, traites, and yields.
For example:
See also:
</small>
Controlled vocabulary for the representation of bibliographic information. See also:
</small>
Standard variable names and naming convention for use with NetCDF. The Climate and Forecast metadata conventions are intended to promote sharing of NetCDF files. The CF conventions define metadata that provide a definitive description of what the data in each variable represents, and the spatial and temporal properties of the data. This enables users of data from different sources to decide which quantities are comparable, and facilitates building applications with powerful extraction, regridding, and display capabilities.
Basic conventions include lower-case letters, numbers, underscores, and US spelling.
Information is encoded in the variable name itself. The basic format is (optional components in []):
[surface] [component] standard_name [at surface] [in medium] [due to process] [assuming condition]
For example:
Standard names have optional canonical units, AMIP and GRIB (GRidded Binary) codes.
The CF standard names have been converted to RDF by several communities, including the Marine Metadata Interoperability (MMI) project.
Dimensions: time, lat, lon, other specify time first (unlimited) lat, lon or x, y extent to field boundaries.
See also:
</small>
Vocabulary and naming conventions for agricultural modeling variables, used by AgMIP. The ICASA master variable list is included, at least in part, in the AgrO ontology. The NARDN-HD Core Harmonized Crop Experiment Data is also taken from the ICASA vocabulary.
ICASA variables have a number of fields, including name, description, type, min and max values.
See also:
</small>
A subset of the ICASA data dictionary representing set of core variables that are commonly collected in field crop experiments. These will be used to harmonize data from USDA experiments as part of a National Agricultural Research Data Network.
Variable naming rules and patterns for any domain developed as part of the CSDMS project as an alternative to CF. CSDMS standard names is considered to have a more flexible community approval mechanism than CF. CSDMS names include object, quantity/attribute parts.
CSDMS names have been converted to RDF as part of the Earth Cube Geosemantic Server project.
See also:
</small>
IPNI is a database of the names and associated basic bibliographical details of seed plants, ferns and lycophytes. It's goal is to eliminate the need for repeated reference to primary sources for basic bibliographic information about plant names.
A curated classification and nomenclature for all of the organisms in the public sequence databases that represents about 10% of the described species of life on the planet. Taxonomy recommended by MIAPPE.
The Agronomy Ontology “describes agronomic practices, agronomic techniques, and agronomic variables used in agronomic experiments.” It is intended as a complementary ontology to the Crop Ontology (CO). Variables are selected out of the International Consortium for Agricultural Systems Applications (ICASA) vocabulary and a mapping between AgrO and ICASA is in progress. AgrO is intended to work with the existing ontologies including ENVO, UO, PATO, IAO, and CHEBI. It will be part of an Agronomy Management System and fieldbook modeled on the CGIAR Breeding Management System to capture agronomic data.
See also:
</small>
The Crop Ontology (CO) contains "Validated concepts along with their inter-relationships on anatomy, structure and phenotype of crops, on trait measurement and methods as well as on Germplasm with the multi-crop passport terms." The ontology is actively used by the CGIAR community and a central part of the Breeding Management System. MIAPPE recommends the CO (along with TO, PO, PATO, XEML) for observed variables.
Shrestha et al (2012) describe a method for representing trait data via the CO.
See also:
</small>
Describes experimental design, environmental conditions and methods associated with the crop study/experiment/trial and their evaluation. CRO is part of the Crop Ontology platform, originally developed for the International Crop Information System (ICIS). CRO is recommended in the MIAPPE standard for general metadata, environment, treatments, and experimental design fields.
See also:
</small>
Cited in Kattge et al (2011) as an example of an ontology used in ecology and environmental sciences to represent measurements and observation. However, the CRO may be better suited for TERRA-REF.
See also:
</small>
Defines concepts/classes used to describe gene function, and relationships between these concepts. GO is a widely-adopted ontology in genetics research, supported by databases such as GEO. This ontology is cited in Krajewski et al (2015) and might be relevant for the TERRA genomics pipeline.
See also:
</small>
Information entities, originally driven by work by OBI (e.g., abstract, author, citation, document etc). IAO covers similar territory to the Dublin Core vocabulary.
Integrated ontology for the description of biological and clinical investigations. This includes a set of 'universal' terms, that are applicable across various biological and technological domains, and domain-specific terms relevant only to a given domain. Recommended by MIAPPE for general metadata, timing and location, and experimental design.
See also:
</small>
Phenotypic qualities (properties).
Recommended in MAIPPE for use in the observed values field.
See also:
</small>
Part of the Plant Ontology (PO), standardized controlled vocabularies to describe various types of treatments given to an individual plant / a population or a cultured tissue and/or cell type sample to evaluate the response on its exposure.
Describes plant anatomy and morphology and stages of development for all plants intended to create a framework for meaningful cross-species queries across gene expression and phenotype data sets from plant genomics and genetics experiment. Recommended by MIAPPE for observed values fields. Along with EO, GO, and TO make up the Gramene database. Links plant anatomy, morphology and growth and development to plant genomics data.
See also:
</small>
Along with EO, GO, and PO, make up the Gramene database to link plant anatomy, morphology and growth and development to plant genomics data. Recommended by MIAPPE for observed values fields.
Example trait entry:
See also:
</small>
General purpose statistics ontology coveraging processes such as statistical tests, their conditions of application, and information needed or resulting from statistical methods, such as probability distributions, variables, spread and variation metrics. Recommended by MIAPPE for experimental design.
See also:
</small>
Metric units for PATO. This OBO ontology defines a set of prefixes (giga, hecto, kilo, etc) and units (area/square meter, volume/liter, rate/count per second, temperature/degree Fahrenheit). The two top-level classes are prefixes and units.
UO is mentioned in relation to the Agronomy Ontology (AGRO), but PATO is also recommended by MIAPPE for observed values fields
While there are general standard units, it seems unlikely that these would ever be gathered in a single place. It seems more useful to define a high-level ontology to represent a "unit" and allow domains and communities to publish their own authoritative lists.
Created to help plant scientists in documenting and sharing metadata describing the abiotic environment.
Standard formats, ontologies, and controlled vocabularies are typically used in the context of specific software systems.
AgMIP "seeks to improve the capability of ecophysiological and economic models to describe the potential impacts of climate change on agricultural systems. AgMIP protocols emphasize the use of multiple models; consequently, data harmonization is essential. This interoperability was achieved by establishing a data exchange mechanism with variables defined in accordance with international standards; implementing a flexibly structured data schema to store experimental data; and designing a method to fill gaps in model-required input data."
See also
BETYdb traits are available as web-page, csv, json, xml. This can be extended to allow spatial, temporal, and taxonomic / genomic queries. Trait vectors can be queries and rendered in several output formats. For example:
Here are some examples from betydb.org.
See also: BETYdb documentation
</small>
System for managing the breeding process including lists of germplasms, defining crosses, managing nurseries, trials, as well as ontologies and statistical analysis.
See also:
</small>
ICIS is "a database system that provides integrated management of global information on crop improvement and management both for individual crops and for farming systems." ICIS is developed by Consultative Group for International Agricultural Research (CGIAR).
See also
Fox and Skovmand (1996). "The International Crop Information System (ICIS) - connects genebank to breeder to farmer’s field." Plant adaptation and crop improvement, CAB International.
</small>
See also:
</small>
See also:
</small>
However, in general the BRAPI returned JSON data without linking context (i.e., not JSON-LD), so it is in essence it’s own data structure.
Other notes:
See also
</small>
German repository for plant research data including image collections from plant phenotyping and microscopy, unfinished genomes, genotyping data, visualizations of morphological plant models, data from mass spectrometry as well as software and documents.
See also:
</small>
“The PLANTS Database provides standardized information about the vascular plants, mosses, liverworts, hornworts, and lichens of the U.S. and its territories. It includes names, plant symbols, checklists, distributional data, species abstracts, characteristics, images, crop information, automated tools, onward Web links, and references.”
See also
</small>
Web based application supports querying the agricultural census and survey statistics. Also available via API.
See also
</small>
Infrastructure to support computational analysis of genomic data from crop and model plants. This includes the large-scale analysis of genotype-phenotype associations, a common set of reference plant genomic data, archiving genomic variation, and a search engine integrating reference bioinformatics databases and physical genetic materials. See also
</small>
One implementation of CF for ecosystem model driver (met, soil) and output (mass, energy dynamics)
Standardized Met driver data
YYYY-MM-DD hh:mm:ssZ: based on ISO 8601 . Optional offset for local time; precision determined by data (e.g. could be YYYY-MM-DD and decimals specified by a period.
Logging
Automated checks
visualizations
testing and continuous integration framework
checking that scans align with plots
At two points in the processing pipeline, metadata derived from collected data is inserted into BETYdb:
At the start of the transfer process, metadata collected and derived during Danforth's initial processing will be pushed.
After transfer to NCSA, extractors running in Clowder will derive further metadata that will be pushed. This is a subset of the metadata that will also be stored in Clowder's database. The complete metadata definitions are still being determined, but will likely include:
plant identifiers
experiment and experimenter
plant age, date, growth medium, and treatment
camera metadata
The software that makes up the terraref system runs on different VM's. Some of the services leveraged by the systems runs in a replicated mode so that the overall system will not stop working if any of the underlying VM's goes down.
Following is the overview of the system as it is running now:
terraref is the frontend for everything, runs nginx
terra-geodashboard runs the geodashboard software, connected to terra-clowder
terra-thredds runs the thredds server (experimental), connected to roger filesystem (using NFS moutn)
terra-es-[123] run elasticsearch 2.4 and for a cluster
terra-mongo-[123] run mongo 3.6 in a replicated cluster, terra-mongo-3 is an arbiter and does not hold any data
terra-postgres runs postgres 9.5
The TERRA hyperspectral data pipeline processes imagery from hyperspectral camera, and ancillary metadata. The pipeline converts the "raw" ENVI-format imagery into netCDF4/HDF5 format with (currently) lossless compression that reduces their size by ~20%. The pipeline also adds suitable ancillary metadata to make the netCDF image files truly self-describing. At the end of the pipeline, the files are typically [ready for xxx]/[uploaded to yyy]/[zzz].
Software dependencies
The pipeline currently depends on three pre-requisites: . .
Pipeline source code
Once the pre-requisite libraries above have been installed, the pipeline itself may be installed by checking-out the TERRAREF computing-pipeline repository. The relevant scripts for hyperspectral imagery are:
Main script * JSON metadata->netCDF4 script
Setup
The pipeline works with input from any location (directories, files, or stdin). Supply the raw image filename(s) (e.g., meat_raw), and the pipeline derives the ancillary filename(s) from this (e.g., meat_raw.hdr, meat_metadata.json). When specifying a directory without a specifice filename, the pipeline processes all files with the suffix "_raw".
shmkdir ~/terrarefcd ~/terrarefgit clone git@github.com:terraref/computing-pipeline.gitgit clone git@github.com:terraref/documentation.git
Run the Hyperspectral Pipeline
shterraref.sh -i ${DATA}/terraref/foo_raw -O ${DATA}/terrarefterraref.sh -I /projects/arpae/terraref/raw_data/lemnatec_field -O /projects/arpae/terraref/outputs/lemnatec_field
Running nightly on ROGER.
Script is hosted at: /gpfs/smallblockFS/home/malone12/terra_backup
Script uses the Spectrum Scale policy engine to find all files that were modified the day prior, and passes that list to a job in the batch system. The job bundles the files into a .tar file, then uses pigz to compress it in parallel across 18 threads. Since this script is run as a job in the batch system, with variables passed with the date, if the batch system is busy, the backups won't need to preclude each other. The .tgz files are then sent over to NCSA Nearline using Globus, then purged from file system.
Runs every night at 23:59. .
This script creates a daily backup every day of the month. On Sundays creates a weekly backup, on the last day of the month it creates a monthly backup and at the last day of the year it will create a yearly backup. This script overwrite existing backups, for example every 1st of the month it will create a backup called bety-d-1 that contains the backup of the 1st of the month. See the script for the rest of the file names.
These backups are copied using crashplan to a central location and should allow recovery in case of a catastrophic failure.
Description of Blue Water's nearline storage system
Github issues:
This video overview will help explain the capture system:
MIAPPE is currently the only standard listed in for the phenotyping domain. While several databases claim to support MIAPPE, the standard is still nascent.
It is worth noting that linked-data methods are supported but optional when depositing data to GEO. The format, similar to the MIAPPE ISA Tab format, does support .
While some communities define explicit metadata schema (e.g., ), another approach is the use of "application profiles." An application profile is declaration of metadata terms adopted by a community or an organization along with the source of the terms. Application profiles are composed of terms drawn from multiple vocubularies or ontologies to define a "schema" or "profile" for metadata. For example, the Dryad metadata profile draws on the Dublin Core, Darwin Core, and Dryad-specific elements.
DCMI .
Example
DCMI
The BETYdb “variables” table defines variables used to represent traits in the BETYdb relational model. There has been some effort to standardize variable names by adopting standard names where variables overlap. A variable is represented as a name, description, units, as well as min/max values.
mentions RDF conversions.
White et al (2013). . Computers and Electronics in Agriculture.
OBO Foundry.
FAO.
RDA.
Shrestha et al (2012). . Front Physiol. 2012 Aug 25;3:326.
Kattge, J.(2011).
Krajewski et al (2015). . Journal of Experimental Botany, 66(18), 5417–5427.
The is an RDF vocabulary intended to facilitate interoperability between data catalogs published on the Web. DCAT defines a set of classes including Dataset, Catalog, CatalogRecord, and Distribution.
The
The is an RDF-based model for publishing multi-dimentional datasets, based in part on the SDMX guidelines. DataCube defines a set of classes including DataSet, Observation, and MeasureProperty that may be relevant to the TERRA project.
is an international initiative for the standarization of the exchange of statistical data and metadata among international organizations. Sponsors of the initiative include Eurostat, European Central Bank, the OECD, World Bank and the UN Statistical Division. They have defined a framework and an exchange format, SDMX-ML, for data exchange. Community members have also developed RDF encodings of the SDMX guidelines that are heavily referenced in the Data Cube vocabulary examples.
The data exchange format is based on a . Data are transfer into and out of the AgMIP Crop Experiment (ACE) and AgMIP Crop Model (ACMO) databases via REST apis using these JSON objects.
Porter et al (2014). . Environmental Modelling and Software. 62:495-508.
presentation
</small>
is used to store TERRA meta-data, provenance, and traits information.
A separate instance of BETYdb is maintained for use by TERRA Ref at . The scope of the TERRA Ref database is limited to high througput phenotyping data and metadata produced and used by the TERRA program. Users can set up their own instances of BETYdb and import any public data in the distributed BETYdb network.
includes accessing data with web interface, API, and R traits package
, see section "uniqueness constraints"
is a curated, open-source, integrated data resource for comparative functional genomics in crops and model plant species
TERRA Ref has an instance of (requires login).
The data encompasses a library of functions that provides programmatic data access and processing services to MODIS Level 1 and Atmosphere data products. These routines enable both SOAP and REST based web service calls against the data archives maintained by MODAPS. These routines mirror existing LAADS Web services.
Online repository for storage and retrieval of raw and analyzed data from Australian Plant Phenomics Facility (APPF) phenotyping platforms. PODD is based on Fedora Commons repository software with data and metadata modeled using OWL/RDFS.
Specifies a standard interface for plant phenotype/genotype databases to serve data for use in crop breeding applications. This is the API used by , which allows users to turn spreadsheets into databases. Examples indicate that the responses will include values linked to the Crop Ontology, for example:
The group has implemented a few features to make it compatible with Field Book in its current state without the use of API.
BMS and the are both pushing for the API and plan on implementing it when it's complete.
Read news about the and
Arend et al (2016). . Database.
terra-clowder runs the data management system clowder, connected to terra-mongo-[123], terra-es-[123], terra-postgres and the (using NFS mount)
Section
Recommended ontologies
General metadata
Ongtology for Biomedical Investigations (OBI), Crop Research Ontology (CRO)
Timing and location
OBI, Gazetteer (GAZ)
Biosource
UNIPROT taxonomy, NCBI taxonomy
Environment, treatments
XEO Environment Ontology, Ontology of Environmental Features (ENVO), CRO
Experimental design
OBI, CRO, Statistics Ontology (STATO)
Observed values
Trait Ontology (TO), Plant Ontology (PO), Crop Ontology (CO), Phenotypic Quality Ontology (PATO), XEO/XEML
Level
Description
0
Reconstructed, unprocessed, full resolution instrument data; artifacts and duplicates removed.
1a
Level 0 plus time-referenced and annotated with calibration coefficients and georeferencing parameters (level 0 is fully recoverable from level 1a data).
1b
Level 1a processed to sensor units (level 0 not recoverable)
2
Derived variables (e. g., NDVI, height, fluorescence) at the level 1 resolution.
3
Level 2 mapped to uniform grid, missing points gap filled; overlapping images combined
4
'phenotypes' derived variables associated with a particular plant or genotype rather than a spatial location
CoGe supports the genomics pipeline required for the TERRA program for Sorghum sequence alignment and analysis. It has a web interface and REST API. CoGe is developed by Eric Lyons and hosted at the University of Arizona, where it is made available for researchers to use. CoGe can be hosted on any server, VM, or Docker container.
Upload files to Cyverse data store. The TERRARef project has a 2TB allocation
Use icommands to transfer to data store
project directory: /iplant/home/shared/terraref
Raw data goes in subdirectory raw_data/
, which is only writable for those sending raw reads.
(CoGe output) can go into output/
Transferring data from Roger to iplant data store
Log in with your account
Click 'Datasets' > 'Create'
Provide a name and description
Click 'Select Files' to choose which files to add
Click 'Upload' to save selected files to dataset
Click 'View Dataset' to confirm. You can add more content with 'Add Files'.
Add metadata, terms of use, etc.
Some metadata may automatically be generated depending on the types of files uploaded. Metadata can be manually added to files or datasets at any time.
Clowder also includes a RESTful API that allows programmatic interactions such as creating new datasets and downloading files. For example, one can request a list of datasets using: GET _clowder home URL_/api/datasets. The current API schema for a Clowder instance can be accessed by selecting API from the ? Help menu in the upper-right corner of the application.
For typical workflows, the following steps are sufficient to push data into Clowder in an organized fashion:
Create a collection to hold relevant datasets (optional) POST /api/collections
provide a name; returns collection ID
Create a dataset to hold relevant files and add it to the collection POST /api/datasets/createempty
provide a name; returns dataset ID POST /api/collections/<collection id>/datasets/<dataset id>
Upload files and metadata to dataset POST /api/datasets/uploadToDataset/<dataset id>
provide file(s) and metadata
An extensive API reference can be found here.
Some files, e.g. those transferred via Globus, will be moved to the server without triggering Clowder's normal upload paths. These must be transmitted in a certain way to ensure proper handling.
Log into Globus and click 'Transfer Files'.
Select your source endpoint, and Terraref as the destination. You need to contact NCSA to ensure you have the necessary credentials and folder space to utilize Globus - unrecognized Globus accounts will not be trusted.
Transfer your files. You will receive a Task ID when the transfer starts.
Send this Task ID and requisite information about the transfer to the TERRAREF Globus Monitor API as a JSON object:
In addition to username and Task ID, you must also send a "contents" object containing each dataset that should be created in Clowder, and the files that belong to that dataset. This allows Clowder to verify it has handled every file in the Globus task.
The JSON object is sent to the API via an HTTP request: POST 141.142.168.72:5454/tasks
For example, with cURL this would be done with: curl -X POST -u <globus_username>:<globus_password> -d <json_object> 141.142.168.72:5454/tasks
In this way Clowder indexes a pointer to the file on disk rather than making a new copy of the file; thus the file will still be accessible via Globus, FTP, or other methods directed at the filesystem.
BETYdb is a database used to centralize data from research done in all TERRA projects. (It is also the name of the Web interface to that database.) Uploading data to BETYdb will allow everyone on the team access to research done on the TERRA project.
Before submitting data to BETYdb, you must first have an account.
Go to the BETYdb homepage.
Click the "Register for BETYdb" button to create an account. If you plan to submit data, be sure to request "Creator" page access level when filling out the sign-up form.
Understand how the database is organized and what search options are avaible. Do this by exploring the data using the Data tab (see next section).
The Data tab contains a menu for searching the database for different types of data. The Data tab is also the pathway to pages allowing you to add new data of your own. But if you have a sizable amount of trait or yield data you wish to submit, you will likely want to use the Bulk Upload wizard (see below).
As an example, try clicking the Data tab and selecting Citations, the first menu item. A page with a list of citations that have already been uploaded into the system appears.
Citations are listed by the first author's last name. For example a journal article written by Andrew Davis and Kerri Shaw would have the name "Davis" in the author slot.
Use the search box located in the top right corner of the page to search for citations by author, year, title, journal, volume, page, URL, or DOI. Note that the search string must exactly match a substring of the value of one of these items (though the matching is case-insensitive).
Each of the other collections listed in the Data menu may be searched similarly. For example, on the Cultivars page you can search cultivars in the system by searching for them by any of several facets pertaining to cultivars, including the name, ecotype, associated species, even the notes. Keep in mind that when switching to a new Data menu item (such as Cultivars), the resulting page will initially show all items of the type selected that are currently on file. (More precisely, since results are paginated, it will show the first twenty-five of those results.)
The Bulk Upload wizard expects data in CSV format, with one row for each set of associated data items. ("Associated data items" usually means a set of measurements made on the same entity at the same time.) Each trait or yield data item must be associated with a citation, site, species, and treatment and may be associated with a specific cultivar of the associated species. Before you can upload data from a data file, this associated citation, site, species, cultivar, and treatment information must already be in place.
Moreover, if you are uploading trait data, your CSV data file must have one or more trait variable columns (and optionally, one or more covariate variable columns), and the names of these columns must match the names of existing variables. (See the discussion of variables below.)
Details on adding associated data
There is no bulk upload process for adding citations, site, species, cultivars, treatment, and variables to the database. They must be added one at a time using Web forms. Since most often a set of dozens or hundreds of traits is associated with a single citation, site, or species (etcetera), usually this is not an undue burden.
Details on checking that items of each particular type exist (and adding them if they don't) follow:
Citations: To check that the needed citations exist, go to the citations listing by clicking Citations in the Data menu. Search for your citation(s) to determine if all citations associated with your data already exist. If they don't, then create new citations as needed. Be sure to fill in all the required data; author, year, and title are required; if at all possible, include the journal name, volume, page numbers, and DOI. (You must include the DOI if that is what your data files uses to identify citations.)
Sites: Go to the Data tab and click on Sites to verify that all sites in your data file are listed on the Sites page. If any of your sites are not already in the system, you will need to add them to the database. To do this, first search the citations list for the associated citation, select it (by clicking the checkmark in the row where it is listed) and then click the New Site button. A new site must have a name, but if possible, supply other information—the city, state, and country where the site is located, the latitude, longitude, and altitude of the site, and possibly climate and soil data.
It is possible that sites referenced by your data are already in the database but that they aren't yet associated with the citation associated with that data. To see the set of sites associated with a given citation, find the citation in the citations list and select it by clicking the checkmark in its row. This will take you to the Listing Sites page; all of the sites associated with the selected citation (if any) will be listed at the top. To associate another site with the selected citation, enter its name in the search box, find the row containing it, and click the "link" action in that row.
Treatments: The treatment specified for each of your data items must not only match the name of an existing treatment, it must also be associated with the citation for the data item. To see the list of treatments associated with a particular citation, select the citation as in the instructions for Sites. Then click the Treatments link on the Listing Sites page. The top section of this page lists all treatments associated with the selected citation.
Currently, there is no way to associate an arbitrary treatment with a citation via the Web interface. You will either have to make a new treatment with the desired name (after the desired citation has been selected), or you will have to (or have an administrator) modify the database directly.
Species: To check that the needed species entries exist, go to the the species listing by clicking Species in the Data menu. Search for each of the species required by your data. The species entry in the CSV file must match the scientific name (Latin name) of the species listed in the database. If necessary, add any species in your data that has not yet been added to the database. When adding a species, scientificname is the only required field, but the genus and species fields should be filled out as well.
Cultivars: If your data lists cultivars, you should check that these are in the database as well. Cultivar names are not necessarily unique, but they are unique within a given species. To check whether a cultivar matching the name and species listed in your CSV file has been added to the database, go to the cultivar listing by clicking Cultivars in the Data menu. Searching either by species name or cultivar name should quickly determine if the needed cultivar exists. If it needs to be added, click the New Cultivar button. Fill in the species search box with enough of the species name to narrow down the result list to a workable size, and then select the correct species from the result list immediately below the search box. Then type the name of the cultivar you wish to add in the Name field. The Ecotype and Notes sections are optional.
Variables: If you are submitting trait data, verify that the variables associated with each trait and each covariate match the names of variables in the system (for example, canopy_height, hull_area, or solidity). To do this, go to the Data tab and click on Variables. If any of your variables are not already in the system, you will need to add them.
For a variable to be recognized as a trait variable or covariate, it is not enough for it simply to be in the variables
table; it must also be in the trait_covariate_associations
table. To check which variables will be recogized as trait variables or covariates, click on the Bulk Upload tab. Then click the link View List of Recognized Traits. This will bring up a table that lists all names of variables recognized as traits and the names of all variables recognized as required or optional covariates for each trait. If you need to add to this table and do not have direct access to the underlying database to which you are submitting data, you will need to e-mail the site adminstrator to request additions. (See the "Contact Us" section in the footer of the BETYdb homepage.)
Once you have entered all the necessary data to prepare for a bulk data upload, you can then begin the bulk upload process.
There are some key rules for bulk uploading:
Templates To help you get started, some data file templates are available. There are four different templates to choose from.
yields_template_by_citation_author_year_title.csv
Use this template if you are uploading yields and you wish to specify the citations by author, year, and title.
yields_template_by_citation_doi.csv
Use this template if you are uploading yields and you wish to specify the citations by DOI.
traits_template_by_citation_author_year_title.csv
Use this template if you are uploading traits and you wish to specify the citations by author, year, and title.
traits_template_by_citation_doi.csv
Use this template if you are uploading traits and you wish to specify the citations by DOI.
These "templates" consist of a single line of text showing a typical header row for a CSV file. In the traits templates, the headings of the form "[trait variable 1]" or "[covariate 1]" must be replaced with actual variable names corresponding to a trait variable or covariate, respectively.
These templates show all possible columns that may be included. In most cases, fewer columns will be needed and the unneeded column headings should be removed. The only programmatically required headings are "yield" (for uploads of yield data), or, for uploads of trait data, the name of at least one recognized trait variable. All other data required for an upload—the citation, site, species, treatment, access level, and date—may be specified interactively, provided that they have a uniform value for all of the trait or yield data in the file being uploaded. (Specification of a cultivar is not required, but it too may be specified interactively if it has a uniform value for all of the data in the file.)
Matching It is important that text values and trait or covariate column names in the data file match records in the database. This includes variable names, site names, species and cultivar names, etc. Note, however, that matching is somewhat lax: the matching is done case-insensitively, and extraneous spaces in values in the data file are ignored.
Some special cases of note: In the case of citation_title
, the supplied value need only match an initial substring of the title specified in the database as long as the combination of author, year, and the initial portion of the title uniquely identifies a citation stored in the database. (The value for citation_title
may even be empty if the author and year together uniquely identify a citation!) And in the case of species names, the letter 'x' may be used to match the times symbol '×' used in names of hybrid species.
Column order The order of columns in the data file is immaterial; in making the template files, an arbitrary order was chosen. But because the data in the data file is displayed for review during the bulk upload process, it may be that some orderings are easier to work with than others.
Quotation rules Since commas are used to delineate columns in CSV files, any data value containing a comma must be surrounded by double quotes. (Single quotes are interpreted as part of the value!) If the value itself contains a double-quote, this double-quote must be doubled ("") in addition to surrounding the value with double quotes.
Character encoding Non-ASCII characters must use UTF-8 encoding.
Blank lines There can be no blank lines in the file, either between data rows or at the end of the file.
Troubleshooting data files
Immediately after uploading a data file (or after specifying the citation if this is done interactively), the Bulk Upload Wizard tries to validate the uploaded file and displays the results of this validation.
The types of errors one may encounter at this stage fall into roughly three categories:
Parsing errors
These are errors at the stage of parsing the CSV file, before the header or data values are even checked. An error at this stage returns one to the file-upload page.
Header errors
These are errors caused by having an incongruous set of headings in the header row. Here are some examples:
There is citation_author
column heading without a corresponding citation_year
and citation_title
heading. It is an error to use one of these headings without the other two.
There is both a citation_doi
heading and a citation_author
, citation_year
, or citation_title
heading. If citation_doi
is used, none of the other citation-related headings is allowed.
There is an SE
heading without an n
heading or vice versa.
There is neither a yield
heading nor a heading corresponding to a recognized trait variable.
There is both a yield
heading and a heading corresponding to a recognized trait variable. A data file can be used to insert data into the traits table or the yields table but not both at once.
There is a cultivar
heading but no species
heading.
If any of these errors occur, validation of data values will not proceed.
There may be other errors associated with the header row that aren't treated as errors as such. For example, if you intend to supply two trait variables per row but misspell one of them, the data in the column headed by the misspelled variable name will simply be ignored. That column will be grayed-out, but the file may still be used to insert data corresponding to the "good" variable (provided there are no other errors). In other words, if you ignore the "ignored column" warning and the gray highlighting, you may end up uploading only a portion of the data you intended to upload.
Value errors
If there are no file-parsing errors or header errors, the Bulk Upload wizard will proceed to validate data values. Valid values will be highlighted in green. Ignored columns will be highlighted in gray. (This will warn you, for example, if you have misspelled the name of a trait variable.) Other colors signify various sorts of errors. A summary of errors is shown at the top of the page with links to rows in which the various errors occur.
Matching value errors
Each row of the CSV file must be associated with a unique citation, site, species, and treatment and may be associated with a unique cultivar. These associations may either be specified in the CSV file or, if a particular association is constant for all rows of the file, it may be specified interactively. If they are specified in the file, problems that may arise include:
The combination of values for citation_author
, citation_year
, and citation_title
do not uniquely identify a citation in the database. (This may be because there are no matches or too many (i.e., more than one) matches. (There should never be multiple database rows having the same combination of author, year, and title, but this is not currently enforced.)
The value for citation_doi
does not uniquely match a citation in the database. (Again, citation DOIs should be unique, but the database schema doesn't enforce this.)
The value for site
does not uniquely match the sitename of a site in the database. (site.sitename
should be unique, but this again is not enforced.)
The site specified in a given row is not consistent with the citation specified in that row. (If you visit the "Show" page for the site, you should see the citation listed at the top of the page right under Viewing Site.)
The value for species
does not match the value of scientificname
for a unique row of the species table. (species.scientificname
should be unique, but the database scheme doesn't currently enforce this.)
The value for treatment
does not match the value of the name of any treatment row in the database.
The value for treatment
in a particular row matches one or more treatments in the database, but none are associated with the citation specified by that row.
The value for treatment
in a particular row matches more that one treatment in the database that is associated with the citation specified by that row. (This error is rare. Names of treatments associated with a particular citation should be unique, but this is not yet enforced.)
The value for cultivar
specified in a particular row is not consistent with the species specified in that row.
Other value errors, not having to do with associated attributes of the data, are as follows:
A value for a trait is out of range. An obvious example would be giving a negative number as the value for annual yield. If a variable value is flagged as being out of range, double check the data. If you determine that the value is indeed correct, you should request to have the range in the database adjusted for that variable.
A value for the measurement date is not in the correct format or is out of range.
A value for the access level is not 1, 2, 3, or 4.
A value of the wrong type is given. Examples would be giving a text value for yield
or a floating point number for n
.
Global options and values
If there are no errors in the data file, the bulk upload will proceed to a page allowing you to choose rounding options for your data values. You may choose to keep 1, 2, 3, or 4 significant digits, 3 being the default. If your data includes a standard error (SE
) column, you may separately specify the amount of rounding for the standard error. Here the default is 2 significant digits.
If you did not specify all associated-data values and or did not specify an access level in the data file itself, this page will also allow you to specify a uniform global value for any association not specified in the file; and it will allow you to specify a uniform access level if your data file did not have an access_level
column.
Verification page
Once you have specified global options and values, you will be taken to a verification page that will summarize the global options you have selected and the associations you specified for your data. The latter will be presented in more detail than any specification in your data file or on the Upload Options and Global Values page. For example, when summarizing the sites associated with your data, not only are the site names listed, but the city, state, country, latitude, longitude, soil type, and soil notes are also displayed. This will help ensure that the citations, sites, species, etc. that you specified are really the ones that you intended.
Once you have verified the data, clicking the Insert Data button will complete the upload. The insertions are done in an SQL transaction: if any insertion fails, the entire transaction is rolled back.
The TERRA REF computing pipeline and data management is managed by Clowder. The pipeline consists of 'extractors' that take a file or other piece of information and generate new files or information. In this way, each extractor is a step in the pipeline.
An extractor 'wraps' an algorithm in code that watches for files that it can convert into new data products and phenotypes. These extractors wait silently alongside the Clowder interface and databases. Extractors can be configured to wait for specific file types and automatically execute operations on those files to process them and extract metadata.
If you want to add an algorithm to the TERRAREF pipeline, or use the Clowder software to manage your own pipeline, extractors provide a way of automating and scaling the algorithms that you have. The NCSA Extractor Development wiki provides instructions, including:
Setting up a pipeline development environment on your own computer.
Using the web development interface) (currently in beta testing)
Using the Clowder API
To make working with the TERRA-REF pipeline as easy as possible, the terrautils Python library was written. By importing this library in an extractor script, developers can ensure that code duplication is minimized and standard practices are used for common tasks such as GeoTIFF creation and georeferencing. It also provides modules for managing metadata, downloading and uploading, and BETYdb/geostreams API wrapping.
Modules include:
betydb BETYdb API wrapper
extractors General extractor tools e.g. for creating metadata JSON objects and generating folder hierarchies
formats Standard methods for creating output files e.g. images from numpy arrays
gdal GDAL general image tools
geostreams Geostreams API wrapper
influx InfluxDB logging API wrapper
lemnatec LemnaTec-specific data management methods
metadata Getting and cleaning metadata
products Get file lists
sensors Standard sensor information resources
spatial Geospatial metadata management
To keep code and algorithms broadly applicable, TERRA-REF is developing a series of science-driven packages to collect methods and algorithms that are generic to an input and output from the pipeline. That is, these packages should not refer to Clowder or extraction pipelines, but instead can be used in applications to manipulate data products. They are organized by sensor.
These packages will also include test suites to verify that any changes are consistent with previous outputs. The test directories can also act as examples on how to instantiate and use the science packages in actual code.
stereo_rgb stereo RGB camera (stereoTop in rawdata, rgb prefix elsewhere)
flir_ir FLIR infrared camera (flirIrCamera in rawData, ir prefix elsewhere)
scanner_3d laser 3D scanner (scanner3DTop in rawData, laser3d elsewhere)
Extractors can be considered wrapper scripts that call methods in the science packages to do work, but include the necessary components to communicate with TERRA's RabbitMQ message bus to process incoming data as it arrives and upload outputs to Clowder. There should be no science-oriented code in the extractor repos - this code should be implemented in science packages instead so it is easier for future developers to leverage.
Each repository includes extractors in the workflow chain corresponding to the named sensor.
Extractor development and deployment: Max Burnette
Development environments: Craig Willis
On our Slack Channel
On GitHub
Accession - plant materials collected from a particular area.
Active reflectance - measurement of light originating from a sensor that reflects off of an object and back to the sensor
Algorithm - a process or set of rules to be followed in calculations or other problem-solving operations
Alignment, sequence - a way of arranging the sequences of DNA, RNA, or protein to identify regions of similarity that may be a consequence of functional, structural, or evolutionary relationships between the sequences
API (application programming interface) - a set of routine definitions, protocols, and tools for building software and applications.
BAM (Binary Alignment/Map) format - binary format for storing sequence data.
BED (Browser Extensible Data) format - format consisting of one line per feature, each containing 3-12 columns of data, plus optional track definition lines.
BETYdb (Biofuel Ecophysiological Traits and Yields database) - a web-based database of plant trait and yield data that supports research, forecasting, and decision making associated with the development and production of cellulosic biofuel crops
BRDF (Bidirectional Reflectance Distribution Function) - a function of four real variables that defines how light is reflected at an opaque surface.
Breeding Management System (BMS) - an information management system developed by the Integrated Breeding Platform to help breeders manage the breeding process, from program planning to decision-making.
Brown Dog - a research project to develop a method for easily accessing historic research data stored in order to maintain the long-term viability of large bodies of scientific research.
BWA - a software package for mapping low-divergent sequences against a large reference genome.
Clowder - a scalable data repository for sharing, organizing and analyzing data
Collections - one or more datasets.
Cultivar - plants selected for desirable characteristics that can be maintained by propagation.
Data product level - relative amount that data products are processed. Level 0 products are raw data at full instrument resolution. At higher levels, the data are converted into more useful parameters and formats.
Data standards - the rules by which data are described and recorded.
Datasets - one or more files with associated metadata collected by one sensor at one time point.
Downwelling spectral irradiance - The component of radiation directed toward the earth's surface per unit frequency or wavelength
Exposure - the amount of light per unit area reaching an electronic image sensor
FASTQ format - a text-based format for storing both a biological sequence (usually nucleotide sequence) and its corresponding quality scores.
FASTX-toolkit - a collection of command line tools for Short-Reads FASTA/FASTQ files preprocessing.
Gantry - a rail-bound crane systems that transport a measurement platform (like the Scanalyzer) over a field
GAPIT (Genome Association and Prediction Integrated Tool) – an R package that performs Genome Wide Association Study (GWAS) and genome prediction (or selection).
GATK (Genome Analysis Toolkit) - a software package for analysis of high-throughput sequencing data
Gbrowse - a combination of database and interactive web pages for manipulating and displaying annotations on genomes.
Generic Model Organism Database (GMOD) - a collection of open source software tools for managing, visualizing, storing, and disseminating genetic and genomic data.
Genome annotation - the process of attaching biological information to sequences.
Genomic coordinates - The beginning and ending positions of an annotation along a sequence
Genotype calling - inferring the genotype carried by an individual at each site
GeoDjango - geographic Web framework for building GIS Web applications
Germplasm - the sum total of genetic resources of an organism.
GFF (General Feature Format) - format consisting of one line per feature, each containing 9 columns of data, plus optional track definition lines
GIS (geographic information system) - a system designed to capture, store, manipulate, analyze, manage, and present all types of spatial or geographical data.
Globus - a connected set of data transfer and sharing services for research data management.
Hierarchical Data Format (HDF) - a set of file formats (HDF4, HDF5) designed to store and organize large amounts of data.
Hyperspectral data - information from across the electromagnetic spectrum.
IGV (Integrative Genomics Viewer) - a high-performance visualization tool for interactive exploration of large, integrated genomic datasets.
Integrated Breeding Platform (IBP) - platform providing integrated, high-performing breeding informatics and management system
Jbrowse - an embeddable genome browser
Json - open-standard format that uses human-readable text to transmit data objects consisting of attribute–value pairs.
Jupyter Notebook - a web application for creating and sharing documents that contain live code, equations, visualizations and explanatory text.
Lemnatec - supplier of software and automated research platforms for plant phenotyping.
Metadata - data that provides information about other data
MLMM (multi-locus mixed-model) - analysis for genome-wide association studies (GWAS) that uses a forward and backward stepwise approach to select markers as fixed effect covariates in the model.
NetCDF - a set of software libraries and self-describing, machine-independent data formats that support the creation, access, and sharing of array-oriented scientific data.
OpenAlea - a distributed collaborative effort to develop Python libraries and tools that address the needs of current and future works in Plant Architecture modeling.
OpenCV (Open Source Computer Vision Library) - an open source computer vision and machine learning software library.
PAR (Photosynthetically Active Radiation) - the amount of light available for photosynthesis, which is light in the 400 to 700 nanometer wavelength range.
Phenotype - the set of observable characteristics of an individual resulting from the interaction of its genotype with the environment.
Phytozome - a project that facilitates comparative genomic studies amongst green plants.
PlantCV - an imaging processing package specific for plants that is built upon open-source software
PostGIS - an open source software program that adds support for geographic objects to the PostgreSQL object-relational database.
Python - a programming language
QA (quality assurance) - a planned system of review procedures conducted outside the actual data compilation.
QC (quality control) - a system of checks to assess and maintain the quality of the data.
Quality scores - measure of the probability that a nucleotide base is correctly identified from DNA sequencing
R/qtl - an extensible, interactive environment for mapping quantitative trait loci (QTL) in experimental crosses.
Raw data - unprocessed data collected from an experiment
Reads - sequence of nucleotides of a segment of DNA
Reference data - data that defines the set of permissible values to be used by other data fields.
RESTful API - an application program interface (API) that uses HTTP requests to get, put, post, and delete data.
ROGER - a cluster housed at NCSA that has 13.3 TB of system memory available for computation
Rstudio - a set of integrated tools for use with R, a software environment for statistical computing and graphics.
SAMtools (Sequence Alignment/Map) – a generic format for storing large nucleotide sequence alignments.
Scanalyzer - instrumentation created by Lemnatec with robotic sensor arm with multiple overhead cameras and sensors
Sequencing - the process of determining the precise order of nucleotides within a DNA molecule.
SNP (single nucleotide polymorphism) - a variation in a single nucleotide that occurs at a specific position in the genome
Spaces - contain collections and datasets. TERRA-REF uses one space for each of the phenotyping platforms.
Spectral exposure - the radiant energy received by a surface, per unit time, per unit frequency
Spectral flux - the radiant energy emitted, reflected, transmitted or received, per unit time, per unit frequency
Spectral response function (SRF) - the quantum efficiency of a sensor at specific wavelengths over the range of a spectral band
SQL (Structured Query Language) is a special-purpose programming language designed for managing data held in a relational database management system
SRA (Sequence Read Archive) - a bioinformatics database that provides a public repository for DNA sequencing data
Standards committee - TERRA project representatives and external advisors who work to create clear definitions of data formats, semantics, and interfaces, file formats, and representations of space, time, and genetic identity based on existing standards, commonly used file formats, and user needs to make it easier to analyze and exchange data and results.
Swagger - a set of rules for a format describing REST API. The format can be used to share documentation among product managers, testers and developers, but can also be used by various tools to automate API-related processes.
TASSEL-GBS - software for investigating the relationship between phenotypes and genotypes
TERRA (Transportation Energy Resources from Renewable Agriculture) - a program funded by ARPA-E program that facilitates the improvement of advanced biofuel crops, by developing and integrating cutting-edge remote sensing platforms, complex data analytics tools, and high-throughput plant breeding technologies.
TERRA-REF (Transportation Energy Resources from Renewable Agriculture Phenotyping Reference Platform) - a research project focused on developing an integrated phenotyping system for energy sorghum that leverages genetics and breeding, automation, remote plant sensing, genomics, and computational analytics.
Thredds: Geospatial Data server - a web server that provides metadata and data access for scientific datasets, using a variety of remote data access protocols
Trait - the morphological, anatomical, physiological, biochemical and phenological characteristics of plants and their organs
Variants - a nucleotide difference in a genotype compared to a reference genotype
VCF - a text file format (most likely stored in a compressed manner). It contains meta-information lines, a header line, and then data lines each containing information about a position in the genome.
Vcftools - a program package designed for working with VCF files
White reference, reflectance of - light reflecting off of a white reference object that is used for the calibration of hyperspectral images
We are developing a set of tutorials described here https://github.com/terraref/tutorials/blob/master/README.md
Note that the tutorials assume that you are using terraref.ndslabs.org which provides all of the software dependencies along with data access.
As contributors and maintainers of this project, we pledge to respect all people who contribute through reporting issues, posting feature requests, updating documentation, submitting pull requests or patches, and other activities.
We are committed to making participation in this project a harassment-free experience for everyone, regardless of level of experience, gender, gender identity and expression, sexual orientation, disability, personal appearance, body size, race, ethnicity, age, or religion.
Examples of unacceptable behavior by participants include the use of sexual language or imagery, derogatory comments or personal attacks, trolling, public or private harassment, insults, or other unprofessional conduct.
Project maintainers have the right and responsibility to remove, edit, or reject comments, commits, code, wiki edits, issues, and other contributions that are not aligned to this Code of Conduct. Project maintainers who do not follow the Code of Conduct may be removed from the project team.
This code of conduct applies both within project spaces and in public spaces when an individual is representing the project or its community.
Instances of abusive, harassing, or otherwise unacceptable behavior may be reported by opening an issue or contacting one or more of the project maintainers.
This Code of Conduct is adapted from the Contributor Covenant, version 1.1.0, available from http://contributor-covenant.org/version/1/1/0/
For use by the TERRA Reference Phenotyping Standards Committee.
All of the web-based software below provides the ability to organize projects hierarchically, facilitate sharing, and support collaboration. Much of this is publicly viewable.
Github github.com/terraref project management, website content and hosting, collaborative software development
Google Drive collaborative editing of documents that we create (notes, manuscripts, etc)
Data products repository https://github.com/terraref/reference-data
issues and milestones: https://github.com/terraref/reference-data/issues
Computational Pipeline Repository https://github.com/terraref/computational-pipeline
issues and milestones: https://github.com/terraref/computational-pipeline/issues
Website for R&D : https://terraref.ncsa.illinois.edu
Documentation
GitHub Repository: https://terraref.ncsa.illinois.edu
Edit in the GitBook Desktop Editor or GitBook Web interface (see GitBook Documentation)
Features
Interface to 'git', a specialized command-line tool for version control.
Issue tracking and discussion forum https://guides.github.com/features/issues/
participants can reply to issues via email, similar to an email discussion list